UNITED STATES
SECURITIES AND EXCHANGE COMMISSION
Washington, D.C. 20549
Form
CURRENT REPORT
Pursuant to Section 13 or 15(d) of the Securities Exchange Act of 1934
Date of Report (Date of earliest event reported):

(Exact name of registrant as specified in its charter)
(State or other jurisdiction | (Commission | (IRS Employer |
(Address of principal executive offices) | (Zip Code) |
Registrant’s telephone number, including area code:
NOT APPLICABLE
(Former name or former address, if changed since last report)
Check the appropriate box below if the Form 8-K filing is intended to simultaneously satisfy the filing obligation of the registrant under any of the following provisions:
Securities registered pursuant to Section 12(b) of the Act:
Title of each class |
| Trading Symbol(s) |
| Name of each exchange on which registered |
Indicate by check mark whether the registrant is an emerging growth company as defined in Rule 405 of the Securities Act of 1933 (§230.405 of this chapter) or Rule 12b-2 of the Securities Exchange Act of 1934 (§240.12b-2 of this chapter).
Emerging growth company
If an emerging growth company, indicate by check mark if the registrant has elected not to use the extended transition period for complying with any new or revised financial accounting standards provided pursuant to Section 13(a) of the Exchange Act. ☐
Item 2.02. Results of Operations and Financial Condition.
On July 23, 2025, Helix Energy Solutions Group, Inc. (“Helix”) issued a press release reporting its financial results for the second quarter 2025. The press release is furnished herewith as Exhibit 99.1 and incorporated herein by reference.
Item 7.01. Regulation FD Disclosure.
On July 23, 2025, Helix issued a press release reporting its financial results for the second quarter 2025. In addition, on July 24, 2025, Helix is making a presentation (with slides) to analysts and investors regarding its financial and operating results. Furnished herewith as Exhibits 99.1 and 99.2, respectively, and incorporated herein by reference, are the press release and the slides for the Second Quarter 2025 Conference Call Presentation issued by Helix. The presentation materials are also available on the Investor Relations section of Helix’s website, www.helixesg.com.
The information furnished pursuant to Items 2.02 and 7.01, including Exhibits 99.1 and 99.2, shall not be deemed to be “filed” for the purposes of Section 18 of the Securities Exchange Act of 1934, as amended, and will not be incorporated by reference into any filing under the Securities Act of 1933, as amended, unless specifically identified therein as being incorporated therein by reference.
Item 9.01. Financial Statements and Exhibits.
(d) Exhibits.
SIGNATURES
Pursuant to the requirements of the Securities Exchange Act of 1934, the Registrant has duly caused this report to be signed on its behalf by the undersigned hereunto duly authorized.
Date: July 23, 2025 |
| ||
HELIX ENERGY SOLUTIONS GROUP, INC. | |||
By: | /s/ Erik Staffeldt | ||
Erik Staffeldt | |||
Executive Vice President and | |||
EXHIBIT 99.1

| | | | | | | | |
Helix Energy Solutions Group, Inc. | ● | 3505 W. Sam Houston Parkway N., Suite 400 | ● | Houston, TX 77043 | ● | 281-618-0400 | ● | fax: 281-618-0505 |
| | | | | | | | |
For Immediate Release | | | | | | | 25-009 | |
| | | | | | | | |
Date: July 23, 2025 | Contact: | Erik Staffeldt | | | | | ||
| | | Executive Vice President & CFO | | | |||
| | | | | | | | |
Helix Reports Second Quarter 2025 Results
HOUSTON, TX – Helix Energy Solutions Group, Inc. (“Helix”) (NYSE: HLX) reported a net loss of $2.6 million, or $(0.02) per diluted share, for the second quarter 2025 compared to net income of $3.1 million, or $0.02 per diluted share, for the first quarter 2025 and net income of $32.3 million, or $0.21 per diluted share, for the second quarter 2024. Helix reported Adjusted EBITDA1 of $42.4 million for the second quarter 2025 compared to $52.0 million for the first quarter 2025 and $96.9 million for the second quarter 2024.
For the six months ended June 30, 2025, Helix reported net income of $0.5 million, or $0.00 per diluted share, compared to net income of $6.0 million, or $0.04 per diluted share, for the six months ended June 30, 2024. Adjusted EBITDA for the six months ended June 30, 2025, was $94.4 million compared to $143.9 million for the six months ended June 30, 2024. The table below summarizes our results of operations:
Summary of Results
($ in thousands, except per share amounts, unaudited)
|
| Three Months Ended |
| Six Months Ended |
| |||||||||||
| | 6/30/2025 | | 6/30/2024 | | 3/31/2025 | | 6/30/2025 | | 6/30/2024 |
| |||||
Revenues | | $ | 302,288 | | $ | 364,797 | | $ | 278,064 | | $ | 580,352 | | $ | 661,008 | |
Gross Profit | | $ | 14,948 | | $ | 75,486 | | $ | 27,538 | | $ | 42,486 | | $ | 95,040 | |
| |
| 5 | % |
| 21 | % |
| 10 | % |
| 7 | % |
| 14 | % |
Net Income (loss) | | $ | (2,598) | | $ | 32,289 | | $ | 3,072 | | $ | 474 | | $ | 6,002 | |
Basic Earnings (Loss) Per Share | | $ | (0.02) | | $ | 0.21 | | $ | 0.02 | | $ | 0.00 | | $ | 0.04 | |
Diluted Earnings (Loss) Per Share | | $ | (0.02) | | $ | 0.21 | | $ | 0.02 | | $ | 0.00 | | $ | 0.04 | |
Adjusted EBITDA1 | | $ | 42,430 | | $ | 96,895 | | $ | 51,985 | | $ | 94,415 | | $ | 143,885 | |
Cash and Cash Equivalents | | $ | 319,743 | | $ | 275,066 | | $ | 369,987 | | $ | 319,743 | | $ | 275,066 | |
Net Debt1 | | $ | (8,131) | | $ | 43,563 | | $ | (58,878) | | $ | (8,131) | | $ | 43,563 | |
Cash Flows from Operating Activities | | $ | (17,133) | | $ | (12,164) | | $ | 16,442 | | $ | (691) | | $ | 52,320 | |
Free Cash Flow1 | | $ | (21,603) | | $ | (16,153) | | $ | 11,954 | | $ | (9,649) | | $ | 45,089 | |
Owen Kratz, President and Chief Executive Officer of Helix, stated, “Our second quarter results reflect marginal seasonal increases in activity levels in the North Sea and Gulf of America shelf as well as a full quarter of operations on the Q7000 in Brazil. The quarterly improvements were more than offset by the negative impacts of the planned regulatory docking of the Q5000 and the return transit of the Q4000 from its Nigeria project. The macro and geopolitical volatility experienced during the second quarter has created significant uncertainties in the market, with customers scaling back spending and pushing work into 2026 and beyond. While we expect significant improvements in our third quarter financial performance, with a lack of visibility in the fourth quarter as projects get pushed to the right, we have risk-assessed our 2025 outlook accordingly. Even with a challenging and disappointing backdrop, we have positioned Helix to generate meaningful free cash flow this year, and we continued to execute our share repurchase plan with 4.6 million shares repurchased during the second quarter. We are seeing some positive signs in the market, with work starting to be secured in the North Sea well intervention market for 2026, a multi-year MSA with Exxon for our Shallow Water segment and a multi-year 800-day minimum commitment trenching contract secured in the North Sea for our Robotics segment.”
|
1 Adjusted EBITDA, Net Debt and Free Cash Flow are non-GAAP measures; see reconciliations below |
Segment Information, Operational and Financial Highlights
($ in thousands, unaudited)
|
| Three Months Ended |
| Six Months Ended | |||||||||||
| | 6/30/2025 | | 6/30/2024 | | 3/31/2025 | | 6/30/2025 | | 6/30/2024 | |||||
Revenues: |
| |
|
| |
|
| |
|
| |
|
| |
|
Well Intervention | | $ | 156,786 | | $ | 217,761 | | $ | 198,374 | | $ | 355,160 | | $ | 429,061 |
Robotics | |
| 85,572 | |
| 81,249 | |
| 51,042 | |
| 136,614 | |
| 131,558 |
Shallow Water Abandonment | | | 50,618 | | | 50,841 | | | 16,818 | | | 67,436 | | | 77,694 |
Production Facilities | |
| 17,081 | |
| 25,400 | |
| 19,837 | |
| 36,918 | |
| 49,552 |
Intercompany Eliminations | |
| (7,769) | |
| (10,454) | |
| (8,007) | |
| (15,776) | |
| (26,857) |
Total | | $ | 302,288 | | $ | 364,797 | | $ | 278,064 | | $ | 580,352 | | $ | 661,008 |
| | | | | | | | | | | | | | | |
Income (Loss) from Operations: | | | | | | | | | | | | | | | |
Well Intervention | | $ | (16,430) | | $ | 29,299 | | $ | 19,970 | | $ | 3,540 | | $ | 47,978 |
Robotics | |
| 19,044 | |
| 28,400 | |
| 5,347 | |
| 24,391 | |
| 33,850 |
Shallow Water Abandonment | | | (357) | | | (281) | | | (13,441) | | | (13,798) | | | (12,709) |
Production Facilities | |
| 4,425 | |
| 9,097 | |
| 6,944 | |
| 11,369 | |
| 7,554 |
Corporate / Other / Eliminations | |
| (9,834) | |
| (13,322) | |
| (10,648) | |
| (20,482) | |
| (24,756) |
Total | | $ | (3,152) | | $ | 53,193 | | $ | 8,172 | | $ | 5,020 | | $ | 51,917 |
Segment Results
Well Intervention
Well Intervention revenues decreased $41.6 million, or 21%, during the second quarter 2025 compared to the prior quarter primarily due to lower utilization and lower integrated project revenues in the Gulf of America, offset in part by higher utilization on the Q7000 in Brazil and higher seasonal utilization in the North Sea during the second quarter 2025. Revenues on the U.S.-based vessels decreased during the second quarter 2025 as the Q4000 spent approximately 45 days transiting back to the Gulf of America and demobilizing after completing its Nigeria project in early April, and the Q5000 underwent an approximate 57-day planned regulatory docking. Revenues on the Q4000 also decreased during the second quarter due to lower integrated project revenues following the completion of the Nigeria project. Revenues on the Q7000 increased as the vessel had a full quarter under contract in Brazil during the second quarter compared to the prior quarter where the vessel had only six days of revenue following its regulatory docking and mobilization. Revenues also increased in the North Sea as expected with seasonally higher utilization during the second quarter on the Well Enhancer, although the Seawell remained warm-stacked throughout the quarter. Overall Well Intervention vessel utilization increased to 72% during the second quarter 2025 compared to 67% during the prior quarter. Compared to the prior quarter, utilization during the second quarter included a higher number of paid transit, mobilization and demobilization days for which revenues have either been deferred or have already been recognized. Well Intervention operating income decreased $36.4 million during the second quarter 2025 compared to the prior quarter. The decrease was due primarily to lower segment revenues and higher costs on the Q7000 with a full quarter of operations, offset in part by cost deferrals on the Q5000 during its planned regulatory docking during the second quarter 2025.
Well Intervention revenues decreased $61.0 million, or 28%, during the second quarter 2025 compared to the second quarter 2024. The decrease was primarily due to lower utilization on the Seawell and in the Gulf of America, offset in part by higher rates in Brazil during the second quarter 2025. Revenues decreased on the Seawell, which was warm stacked during the second quarter 2025 compared to being fully utilized during the second quarter 2024. Revenues were lower on the Gulf of America vessels due to fewer operational days on the Q4000, which incurred higher transit and demobilization days, and due to lower utilization on the Q5000, which underwent an approximate 57-day planned regulatory dry dock during the second quarter 2025. Revenues increased in Brazil during the second quarter 2025 as the Siem Helix 1 and Siem Helix 2 operated at higher contractual rates compared to the second quarter 2024. Overall Well Intervention vessel utilization decreased to 72% during the second quarter 2025 compared to 94% during the second quarter 2024. Well Intervention operating income decreased $45.7 million during the second quarter 2025 compared to the second quarter 2024 primarily due to lower revenues, offset in part by lower vessel costs from stacking the Seawell and cost deferrals on the Q5000 docking during the second quarter 2025.
Robotics
Robotics revenues increased $34.5 million, or 68%, during the second quarter 2025 compared to the prior quarter. The increase in revenues was due to seasonally higher vessel days and trenching and ROV utilization compared to the prior quarter. During the second quarter 2025, chartered vessel activity increased to 537 days, or 95% utilization, compared to 244 days, or 67% utilization, and ROV and trencher utilization increased to 62% compared to 51% during the prior quarter. Integrated vessel trenching increased to 157 days during the second quarter 2025 compared to 135 days during the prior quarter. During the second quarter 2025, we launched our third IROV boulder grab, and site clearance operations using our IROV boulder grabs generated 190 days of utilization compared to 21 days during the prior quarter. Robotics operating income increased $13.7 million during the second quarter 2025 compared to the prior quarter primarily due to higher revenues, offset in part by increased vessel charter costs, during the second quarter 2025.
Robotics revenues increased $4.3 million, or 5%, during the second quarter 2025 compared to the second quarter 2024. The increase in revenues was primarily due to increased chartered vessel and site clearance activities, offset in part by a reduction in ROV and trencher utilization compared to the second quarter 2024. The second quarter 2025 included 537 chartered vessel days, which included 190 days of site clearance operations using three IROV boulder grabs, compared to 528 chartered vessel days, which included 78 days of site clearance operations using two IROV boulder grabs, during the second quarter 2024. The second quarter 2025 also included 91 days of trenching on a third-party vessel, whereas there was no trenching from a third-party vessel during the second quarter 2024. Offsetting the increases were reductions in integrated vessel trenching days and ROV utilization. Integrated vessel trenching decreased to 157 days during the second quarter 2025 compared to 232 days during the second quarter 2024, and ROV utilization decreased to 64% during the second quarter 2025 compared to 80% during the second quarter 2024. Robotics operating income decreased $9.4 million during the second quarter 2025 due to higher vessel costs and lower margins compared to the second quarter 2024.
Shallow Water Abandonment
Shallow Water Abandonment revenues increased $33.8 million, or 201%, during the second quarter 2025 compared to the prior quarter. The increase in revenues reflected seasonally higher activity levels and utilization across all asset classes during the second quarter 2025. Vessel utilization (excluding heavy lift) increased to 61% during the second quarter 2025 compared to 31% during the prior quarter. Plug and Abandonment (“P&A”) and Coiled Tubing (“CT”) systems activity increased to 798 days, or 34% utilization, during the second quarter 2025 compared to 264 days, or 11% utilization, during the prior quarter. The Epic Hedron heavy lift barge had 38% utilization during the second quarter 2025 compared to being idle during the prior quarter. Shallow Water Abandonment generated an operating loss of $0.4 million during the second quarter 2025, an improvement of $13.1 million compared to the prior quarter primarily due to higher seasonal revenues and related operating costs during the second quarter 2025.
Shallow Water Abandonment revenues decreased $0.2 million during the second quarter 2025 compared to the second quarter 2024 primarily due to lower day rates on our vessels and P&A systems, lower heavy lift utilization and weaker contract performance during the second quarter 2025, almost entirely offset by higher system and vessel utilization (excluding heavy lift). The Epic Hedron heavy lift barge had 38% utilization during the second quarter 2025 compared 46% utilization during the second quarter 2024. Offsetting these decreases were higher utilization on P&A and CT systems, which increased to 798 days, or 34%, during the second quarter 2025 compared to 632 days, or 27%, during the second quarter 2024 and higher utilization on vessels (excluding heavy lift), which increased to 61% during the second quarter 2025 compared to 58% during the second quarter 2024. Shallow Water Abandonment operating losses increased $0.1 million in the second quarter 2025 primarily due to lower revenues compared to the second quarter 2024.
Production Facilities
Production Facilities revenues decreased $2.8 million, or 14%, during the second quarter 2025 compared to the prior quarter primarily due to lower oil and gas production and prices from the Droshky field. The Droshky field had a full quarter of production during the first quarter 2025 but was shut in for approximately one month during the second quarter 2025, and the Thunder Hawk field remained shut in during both quarters. Additionally, oil prices were approximately $6 per barrel lower during the second quarter 2025 compared to the prior quarter. Production Facilities operating income decreased $2.5 million during the second quarter 2025 primarily due to lower revenues compared to the prior quarter.
Production Facilities revenues decreased $8.3 million, or 33%, during the second quarter 2025 compared to the second quarter 2024 primarily due to lower oil and gas production and prices during the second quarter 2025. During the second quarter 2025, the Thunder Hawk field remained shut in the entire quarter and the Droshky field was shut in for approximately one month, whereas both fields had a full quarter of production during the second quarter 2024. Additionally, oil prices were approximately $15 per barrel lower during the second quarter 2025 compared to the second quarter 2024. Production Facilities operating income decreased $4.7 million during the second quarter 2025 primarily due to lower revenues offset in part by lower production-related costs compared to the second quarter 2024.
Selling, General and Administrative and Other
Share Repurchases
Share repurchases totaled approximately 4.6 million shares of our common stock for approximately $30.0 million during the second quarter 2025.
Selling, General and Administrative
Selling, general and administrative expenses were $18.1 million, or 6.0% of revenue, during the second quarter 2025 compared to $19.4 million, or 7.0% of revenue, during the prior quarter and $22.3 million, or 6.1% of revenue, during the second quarter 2024. The decrease in expenses during the second quarter 2025 was primarily due to lower compensation costs compared to the prior quarter and prior year.
Other Income and Expense
Other income, net was $0.4 million during the second quarter 2025 compared to other expense, net of $0.4 million during the prior quarter and other expense, net of $0.4 million during the second quarter 2024. Other income and expense, net primarily includes net foreign currency gains and losses, respectively, related to the British pound on our U.K subsidiaries’ foreign currency positions.
Cash Flows
Operating cash flows were $(17.1) million during the second quarter 2025 compared to $16.4 million during the prior quarter and $(12.2) million during the second quarter 2024. Second quarter 2025 operating cash flows decreased primarily due to lower earnings and higher working capital outflows compared to the prior quarter. Second quarter 2025 operating cash flows decreased compared to the second quarter 2024 primarily due to lower earnings and higher regulatory certification costs on our vessels and systems during the second quarter 2025, offset in part by the payment of $58.3 million related to the Alliance earn-out and by higher working capital outflows during the second quarter 2024. Regulatory certifications for our vessels and systems, which are included in operating cash flows, were $16.1 million during the second quarter 2025 compared to $17.9 million during the prior quarter and $10.7 million during the second quarter 2024.
Capital expenditures, which are included in investing cash flows, totaled $4.5 million during the second quarter 2025 compared to $4.5 million during the prior quarter and $4.0 million during the second quarter 2024.
Free Cash Flow was $(21.6) million during the second quarter 2025 compared to $12.0 million during the prior quarter and $(16.2) million during the second quarter 2024. The decrease in Free Cash Flow in the second quarter 2025 compared to the prior quarter and the second quarter 2024 was due primarily to lower operating cash flows during the second quarter 2025. (Free Cash Flow is a non-GAAP measure. See reconciliation below.)
Financial Condition and Liquidity
Cash and cash equivalents were $319.7 million at June 30, 2025. Available capacity under our ABL facility at June 30, 2025, was $70.5 million, and total liquidity was $374.9 million, excluding $15.3 million pledged toward our ABL facility. Consolidated long-term debt was $311.6 million at June 30, 2025, resulting in negative Net Debt of $8.1 million. (Net Debt is a non-GAAP measure. See reconciliation below.)
* * * * *
Conference Call Information
Further details are provided in the presentation for Helix’s quarterly teleconference to review its second quarter 2025 results (see the Investor Relations page of Helix’s website, www.helixesg.com). The teleconference is scheduled for Thursday, July 24, 2025, at 9:00 a.m. Central Time. Investors and other interested parties wishing to participate in the teleconference should dial 1-800-715-9871 within the United States and 1-646-307-1963 outside the United States. The passcode is “Staffeldt.” A live webcast of the teleconference will be available in a listen-only mode on the Investor Relations section of Helix’s website. A replay of the webcast will be available on Helix’s website shortly after the completion of the event.
About Helix
Helix Energy Solutions Group, Inc., headquartered in Houston, Texas, is an international offshore energy services company that provides specialty services to the offshore energy industry, with a focus on well intervention, robotics and decommissioning operations. Our services are key in supporting a global energy transition by maximizing production of existing oil and gas reserves, decommissioning end-of-life oil and gas fields and supporting renewable energy developments. For more information about Helix, please visit our website at www.helixesg.com.
Non-GAAP Financial Measures
Management evaluates operating performance and financial condition using certain non-GAAP measures, primarily EBITDA, Adjusted EBITDA, Free Cash Flow and Net Debt. We define EBITDA as earnings before income taxes, net interest expense, net other income or expense, and depreciation and amortization expense. Non-cash impairment losses on goodwill and other long-lived assets are also added back if applicable. To arrive at our measure of Adjusted EBITDA, we exclude gains or losses on disposition of assets, acquisition and integration costs, gains or losses related to convertible senior notes, the change in fair value of contingent consideration, and the general provision (release) for current expected credit losses, if any. We define Free Cash Flow as cash flows from operating activities less capital expenditures, net of proceeds from asset sales and insurance recoveries (related to property and equipment), if any. Net Debt is calculated as long-term debt including current maturities of long-term debt less cash and cash equivalents and restricted cash.
We use EBITDA, Adjusted EBITDA, Free Cash Flow and Net Debt to monitor and facilitate internal evaluation of the performance of our business operations, to facilitate external comparison of our business results to those of others in our industry, to analyze and evaluate financial and strategic planning decisions regarding future investments and acquisitions, to plan and evaluate operating budgets, and in certain cases, to report our results to the holders of our debt as required by our debt covenants. We believe that our measures of EBITDA, Adjusted EBITDA, Free Cash Flow and Net Debt provide useful information to the public regarding our operating performance and ability to service debt and fund capital expenditures and may help our investors understand and compare our results to other companies that have different financing, capital and tax structures. Other companies may calculate their measures of EBITDA, Adjusted EBITDA, Free Cash Flow and Net Debt differently from the way we do, which may limit their usefulness as comparative measures. EBITDA, Adjusted EBITDA, Free Cash Flow and Net Debt should not be considered in isolation or as a substitute for, but instead are supplemental to, income from operations, net income, cash flows from operating activities, or other income or cash flow data prepared in accordance with GAAP. Users of this financial information should consider the types of events and transactions that are excluded from these measures. See reconciliation of the non-GAAP financial information presented in this press release to the most directly comparable financial information presented in accordance with GAAP. We have not provided reconciliations of forward-looking non-GAAP financial measures to comparable GAAP measures due to the challenges and impracticability with estimating some of the items without unreasonable effort, which amounts could be significant.
Forward-Looking Statements
This press release contains forward-looking statements that involve risks, uncertainties and assumptions that could cause our results to differ materially from those expressed or implied by such forward-looking statements. All statements, other than statements of historical fact, are “forward-looking statements” within the meaning of the Private Securities Litigation Reform Act of 1995, including, without limitation, any statements regarding: our plans, strategies and objectives for future operations; any projections of financial items including projections as to guidance and other outlook information; future operations expenditures; our ability to enter into, renew and/or perform commercial contracts; the spot market; our current work continuing; visibility and future utilization; our protocols and plans; future economic or political conditions; energy transition or energy security; our spending and cost management efforts and our ability to manage changes; oil price volatility and its effects and results; our ability to identify, effect and integrate mergers, acquisitions, joint ventures or other transactions, including the integration of the Alliance acquisition and any subsequently identified legacy issues with respect thereto; developments; any financing transactions or arrangements or our ability to enter into such transactions or arrangements; our sustainability initiatives; our share repurchase program or execution; any statements of expectation or belief; and any statements of assumptions underlying any of the foregoing. Forward-looking statements are subject to a number of known and unknown risks, uncertainties and other factors that could cause results to differ materially from those in the forward-looking statements, including but not limited to market conditions and the demand for our services; volatility of oil and natural gas prices; complexities of global political and economic developments, including tariffs; results from mergers, acquisitions, joint ventures or similar transactions; results from acquired properties; our ability to secure and realize backlog; the performance of contracts by customers, suppliers and other counterparties; actions by governmental and regulatory authorities; operating hazards and delays, which include delays in delivery, chartering or customer acceptance of assets or terms of their acceptance; the effectiveness of our sustainability initiatives and disclosures; human capital management issues; geologic risks; and other risks described from time to time in our filings with the Securities and Exchange Commission (“SEC”), including our most recently filed Annual Report on Form 10-K, which are available free of charge on the SEC’s website at www.sec.gov. We assume no obligation and do not intend to update these forward-looking statements, which speak only as of their respective dates, except as required by law.
HELIX ENERGY SOLUTIONS GROUP, INC.
| |
| Three Months Ended June 30, |
| Six Months Ended June 30, | ||||||||
(in thousands, except per share data) | | | 2025 | | 2024 | | 2025 | | 2024 | ||||
| | | (unaudited) | | (unaudited) | ||||||||
| | | | | | | | | | | | | |
Net revenues | | | $ | 302,288 | | $ | 364,797 | | $ | 580,352 | | $ | 661,008 |
Cost of sales | | |
| 287,340 | |
| 289,311 | |
| 537,866 | |
| 565,968 |
Gross profit | | |
| 14,948 | |
| 75,486 | |
| 42,486 | |
| 95,040 |
Loss on disposition of assets, net | |
| — | |
| — | |
| — | |
| (150) | |
Selling, general and administrative expenses | |
| (18,100) | |
| (22,293) | |
| (37,466) | |
| (42,973) | |
Income (loss) from operations | |
| (3,152) | |
| 53,193 | |
| 5,020 | |
| 51,917 | |
Net interest expense | | |
| (5,875) | |
| (5,891) | |
| (11,581) | |
| (11,368) |
Losses related to convertible senior notes | |
| — | |
| — | |
| — | |
| (20,922) | |
Other income (expense), net | |
| 437 | |
| (382) | |
| 80 | |
| (2,598) | |
Royalty income and other | |
| (5) | |
| 94 | |
| 1,411 | |
| 2,000 | |
Income (loss) before income taxes | |
| (8,595) | |
| 47,014 | |
| (5,070) | |
| 19,029 | |
Income tax provision (benefit) | |
| (5,997) | |
| 14,725 | |
| (5,544) | |
| 13,027 | |
Net income (loss) | | | $ | (2,598) | | $ | 32,289 | | $ | 474 | | $ | 6,002 |
| | | | | | | | | | | | | |
Earnings (loss) per share of common stock: | | | | | | | | | | | | | |
Basic | | | $ | (0.02) | | $ | 0.21 | | $ | 0.00 | | $ | 0.04 |
Diluted | | | $ | (0.02) | | $ | 0.21 | | $ | 0.00 | | $ | 0.04 |
| | | | | | | | | | | | | |
Weighted average common shares outstanding: | | | | | | | | | | | | | |
Basic | | |
| 148,515 | |
| 152,234 | |
| 149,770 | |
| 152,301 |
Diluted | | |
| 148,515 | |
| 155,024 | |
| 150,539 | |
| 155,072 |
| |
| June 30, 2025 |
| Dec. 31, 2024 | ||
(in thousands) | | | (unaudited) | | | | |
| | | | | | | |
ASSETS | |
| |
|
| |
|
| | | | | | | |
Current Assets: | |
| |
|
| |
|
Cash and cash equivalents | | | $ | 319,743 | | $ | 368,030 |
Accounts receivable, net | | |
| 327,921 | |
| 258,630 |
Other current assets | | |
| 112,735 | |
| 83,022 |
Total Current Assets | | |
| 760,399 | |
| 709,682 |
| | | | | | | |
Property and equipment, net | | |
| 1,454,288 | |
| 1,437,853 |
Operating lease right-of-use assets | | |
| 314,263 | |
| 329,649 |
Deferred recertification and dry dock costs, net | | | 97,576 | | | 71,718 | |
Other assets, net | | |
| 46,035 | |
| 48,178 |
Total Assets | | | $ | 2,672,561 | | $ | 2,597,080 |
| | | | | | | |
LIABILITIES AND SHAREHOLDERS' EQUITY | | | | | | | |
| | | | | | | |
Current Liabilities: | | | | | | | |
Accounts payable | | | $ | 172,255 | | $ | 144,793 |
Accrued liabilities | | |
| 104,772 | |
| 90,455 |
Current maturities of long-term debt | | |
| 9,412 | |
| 9,186 |
Current operating lease liabilities | | |
| 61,525 | |
| 59,982 |
Total Current Liabilities | | |
| 347,964 | |
| 304,416 |
| | | | | | | |
Long-term debt | | |
| 302,200 | |
| 305,971 |
Operating lease liabilities | | |
| 270,119 | |
| 285,984 |
Deferred tax liabilities | | |
| 114,734 | |
| 113,973 |
Other non-current liabilities | | |
| 68,768 | |
| 66,971 |
Shareholders' equity | | |
| 1,568,776 | |
| 1,519,765 |
Total Liabilities and Equity | | | $ | 2,672,561 | | $ | 2,597,080 |
HELIX ENERGY SOLUTIONS GROUP, INC.
| | | Six Months Ended | ||||
(in thousands) | |
| 6/30/2025 |
| 6/30/2024 | ||
| | | (unaudited) | ||||
Cash flows from operating activities: | |
| |
| | |
|
Net income | | | $ | 474 | | $ | 6,002 |
Adjustments to reconcile net income to net cash provided by operating activities: | |
| | |
|
| |
Depreciation and amortization | | |
| 87,871 | |
| 89,824 |
Deferred recertification and dry dock costs | | | (33,931) | | | (20,330) | |
Payment of earnout consideration | | | | — | | | (58,300) |
Losses related to convertible senior notes | |
| — | |
| 20,922 | |
Working capital and other | | |
| (55,105) | |
| 14,202 |
Net cash provided by (used in) operating activities | |
| (691) | |
| 52,320 | |
| | | | | | | |
Cash flows from investing activities: | | |
|
| |
|
|
Capital expenditures | | |
| (8,958) | |
| (7,594) |
Proceeds from insurance recoveries | | |
| — | |
| 363 |
Net cash used in investing activities | |
| (8,958) | |
| (7,231) | |
| | | | | | | |
Cash flows from financing activities: | | |
|
| |
|
|
Repayments of long-term debt | | |
| (4,537) | |
| (65,042) |
Repurchases of common stock | | | | (30,214) | | | (10,189) |
Payment of earnout consideration | | | | — | | | (26,700) |
Other financing activities | | | | (6,029) | | | 405 |
Net cash used in financing activities | |
| (40,780) | |
| (101,526) | |
| | | | | | | |
Effect of exchange rate changes on cash and cash equivalents | |
| 2,142 | |
| (688) | |
Net decrease in cash and cash equivalents | |
| (48,287) | |
| (57,125) | |
Cash and cash equivalents: | | |
|
| |
|
|
Balance, beginning of year | | |
| 368,030 | |
| 332,191 |
Balance, end of period | | | $ | 319,743 | | $ | 275,066 |
| | |
| Three Months Ended |
| Six Months Ended | |||||||||||
(in thousands, unaudited) | | | | 6/30/2025 | | 6/30/2024 | | 3/31/2025 | | 6/30/2025 | | 6/30/2024 | |||||
| | | | | | | | | | | | | | | | | |
Reconciliation from Net Income (loss) to Adjusted EBITDA: |
| |
|
| |
|
| |
|
| |
|
| |
| ||
Net income (loss) | | | | $ | (2,598) | | $ | 32,289 | | $ | 3,072 | | $ | 474 | | $ | 6,002 |
Adjustments: | | | | | | | | | | | | | | | | | |
Income tax provision (benefit) | | | |
| (5,997) | |
| 14,725 | |
| 453 | |
| (5,544) | |
| 13,027 |
Net interest expense | | | |
| 5,875 | |
| 5,891 | |
| 5,706 | |
| 11,581 | |
| 11,368 |
Other (income) expense, net | | | |
| (437) | |
| 382 | |
| 357 | |
| (80) | |
| 2,598 |
Depreciation and amortization | | | |
| 45,389 | |
| 43,471 | |
| 42,482 | |
| 87,871 | |
| 89,824 |
EBITDA | | | |
| 42,232 | |
| 96,758 | |
| 52,070 | |
| 94,302 | |
| 122,819 |
Adjustments: | | | | | | | | | | | | | | | | | |
Loss on disposition of assets, net | |
| — | |
| — | |
| — | |
| — | |
| 150 | ||
General provision for (release of) current expected credit losses | |
| 198 | |
| 137 | |
| (85) | |
| 113 | |
| (6) | ||
Losses related to convertible senior notes | |
| — | |
| — | |
| — | |
| — | |
| 20,922 | ||
Adjusted EBITDA | | | | $ | 42,430 | | $ | 96,895 | | $ | 51,985 | | $ | 94,415 | | $ | 143,885 |
| | | | | | | | | | | | | | | | | |
Free Cash Flow: | | | | | | | | | | | | | | | | | |
Cash flows from operating activities | | | $ | (17,133) | | $ | (12,164) | | $ | 16,442 | | $ | (691) | | $ | 52,320 | |
Less: Capital expenditures, net of proceeds from asset sales and insurance recoveries | |
| (4,470) | |
| (3,989) | |
| (4,488) | |
| (8,958) | |
| (7,231) | ||
Free Cash Flow | | | | $ | (21,603) | | $ | (16,153) | | $ | 11,954 | | $ | (9,649) | | $ | 45,089 |
| | | | | | | | | | | | | | | | | |
Net Debt: | | | | | | | | | | | | | | | | | |
Long-term debt including current maturities | | | $ | 311,612 | | $ | 318,629 | | $ | 311,109 | | $ | 311,612 | | $ | 318,629 | |
Less: Cash and cash equivalents | |
| (319,743) | |
| (275,066) | |
| (369,987) | |
| (319,743) | |
| (275,066) | ||
Net Debt | | | | $ | (8,131) | | $ | 43,563 | | $ | (58,878) | | $ | (8,131) | | $ | 43,563 |
| July 24, 2025 Second Quarter 2025 Earnings Conference Call EXHIBIT 99.2 |

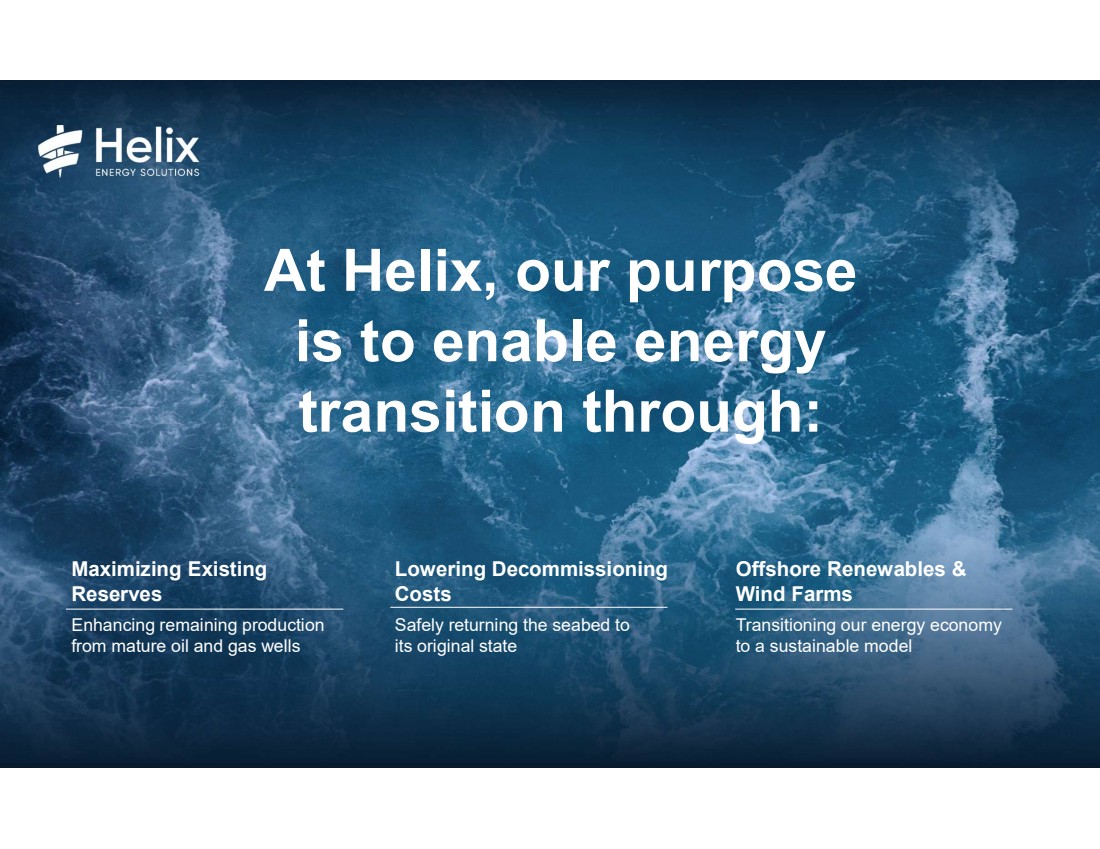
| At Helix, our purpose is to enable energy transition through: Maximizing Existing Reserves Enhancing remaining production from mature oil and gas wells Lowering Decommissioning Costs Safely returning the seabed to its original state Offshore Renewables & Wind Farms Transitioning our energy economy to a sustainable model |
| Page 3 © 2025 Helix ESG This presentation contains forward-looking statements that involve risks, uncertainties and assumptions that could cause our results to differ materially from those expressed or implied by such forward-looking statements. All statements, other than statements of historical fact, are "forward-looking statements" within the meaning of the Private Securities Litigation Reform Act of 1995, including, without limitation, any statements regarding: our plans, strategies and objectives for future operations; any projections of financial items including projections as to guidance and other outlook information; future operations expenditures; our ability to enter into, renew and/or perform commercial contracts; the spot market; our current work continuing; visibility and future utilization; our protocols and plans; future economic or political conditions; energy transition or energy security; our spending and cost management efforts and our ability to manage changes; oil price volatility and its effects and results; our ability to identify, effect and integrate mergers, acquisitions, joint ventures or other transactions, including the integration of the Alliance acquisition and any subsequently identified legacy issues with respect thereto; developments; any financing transactions or arrangements or our ability to enter into such transactions or arrangements; our sustainability initiatives; our share repurchase program or execution; any statements of expectation or belief; and any statements of assumptions underlying any of the foregoing. Forward-looking statements are subject to a number of known and unknown risks, uncertainties and other factors that could cause results to differ materially from those in the forward-looking statements, including but not limited to market conditions and the demand for our services; volatility of oil and natural gas prices; complexities of global political and economic developments; results from mergers, acquisitions, joint ventures or similar transactions; results from acquired properties; our ability to secure and realize backlog; the performance of contracts by customers, suppliers and other counterparties; actions by governmental and regulatory authorities; operating hazards and delays, which include delays in delivery, chartering or customer acceptance of assets or terms of their acceptance; the effectiveness of our sustainability initiatives and disclosures; human capital management issues; geologic risks; and other risks described from time to time in our filings with the Securities and Exchange Commission ("SEC"), including our most recently filed Annual Report on Form 10-K, which are available free of charge on the SEC's website at www.sec.gov. We assume no obligation and do not intend to update these forward-looking statements, which speak only as of their respective dates, except as required by law. Forward-Looking Statements |
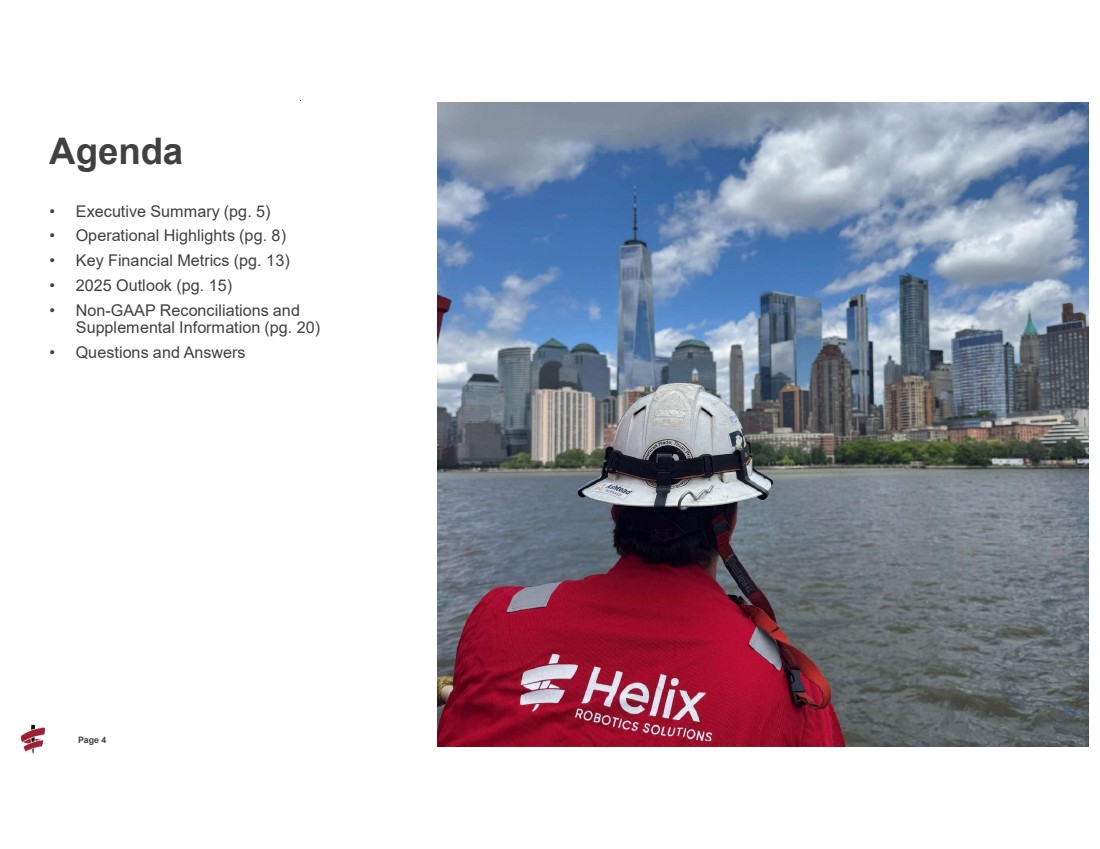
| 4 Page 4 © 2025 Helix ESG • Executive Summary (pg. 5) • Operational Highlights (pg. 8) • Key Financial Metrics (pg. 13) • 2025 Outlook (pg. 15) • Non-GAAP Reconciliations and Supplemental Information (pg. 20) • Questions and Answers Agenda |
| Executive Summary |
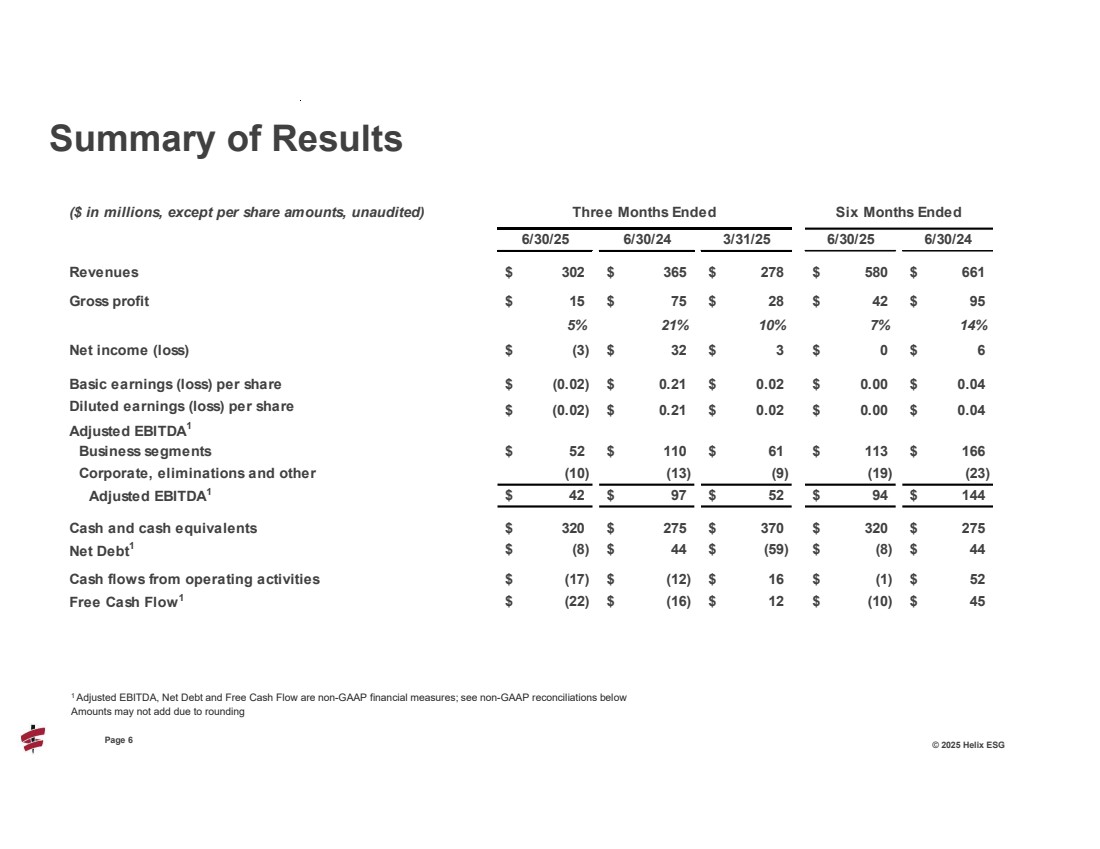
| 6 Page 6 © 2025 Helix ESG Summary of Results ($ in millions, except per share amounts, unaudited) Three Months Ended 6/30/25 6/30/24 3/31/25 6/30/25 6/30/24 Revenues 302 $ 365 $ 278 $ 580 $ 661 $ Gross profit 15 $ 75 $ 28 $ 42 $ 95 $ 5% 21% 10% 7% 14% Net income (loss) (3) $ 32 $ 3 $ 0 $ 6 $ Basic earnings (loss) per share (0.02) $ 0.21 $ 0.02 $ 0.00 $ 0.04 $ Diluted earnings (loss) per share $ 0.21 (0.02) $ 0.02 $ 0.00 $ 0.04 $ Adjusted EBITDA1 Business segments 52 $ 110 $ 61 $ 113 $ 166 $ Corporate, eliminations and other (10) (13) (9) (19) (23) Adjusted EBITDA1 $ 97 42 $ 52 $ 94 $ 144 $ Cash and cash equivalents 320 $ 275 $ 370 $ 320 $ 275 $ Net Debt1 $ 44 (8) $ (59) $ (8) $ 44 $ Cash flows from operating activities (17) $ (12) $ 16 $ (1) $ 52 $ Free Cash Flow1 $ (16) (22) $ 12 $ (10) $ 45 $ Six Months Ended 1 Adjusted EBITDA, Net Debt and Free Cash Flow are non-GAAP financial measures; see non-GAAP reconciliations below Amounts may not add due to rounding |
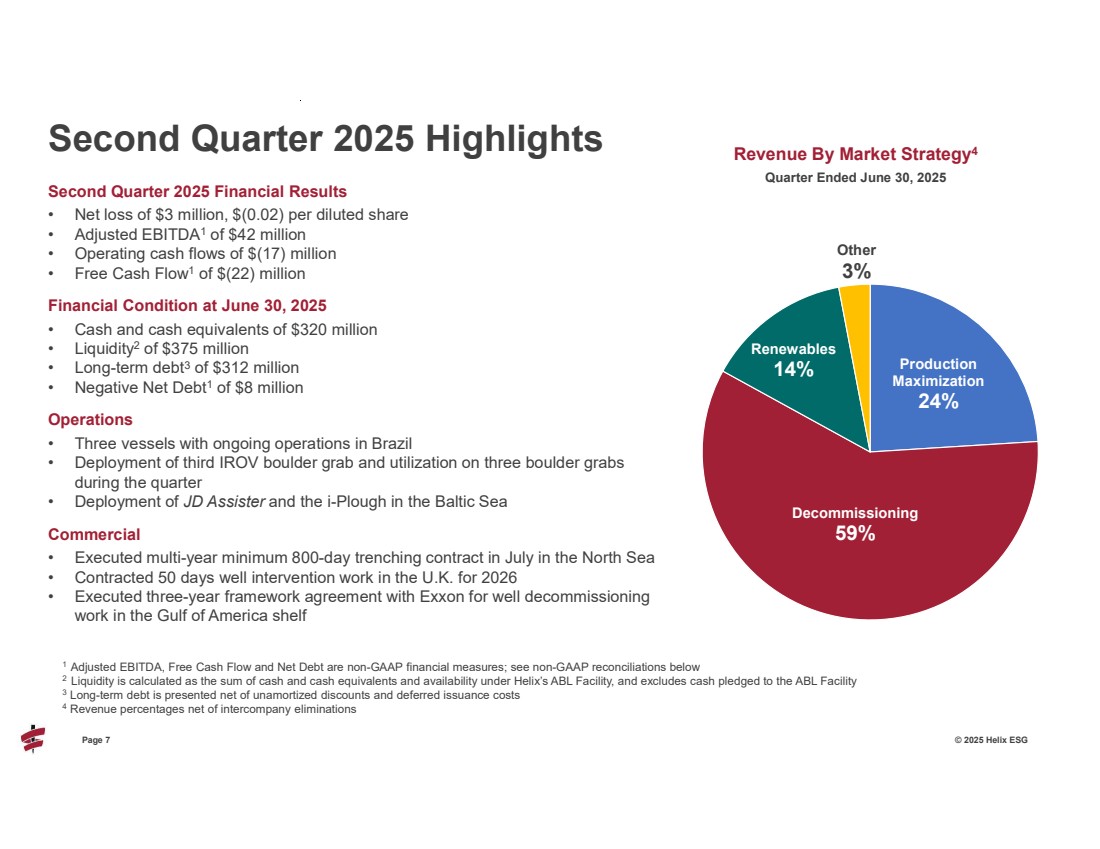
| Page 7 © 2025 Helix ESG Second Quarter 2025 Financial Results • Net loss of $3 million, $(0.02) per diluted share • Adjusted EBITDA1 of $42 million • Operating cash flows of $(17) million • Free Cash Flow1 of $(22) million Financial Condition at June 30, 2025 • Cash and cash equivalents of $320 million • Liquidity2 of $375 million • Long-term debt3 of $312 million • Negative Net Debt1 of $8 million Operations • Three vessels with ongoing operations in Brazil • Deployment of third IROV boulder grab and utilization on three boulder grabs during the quarter • Deployment of JD Assister and the i-Plough in the Baltic Sea Commercial • Executed multi-year minimum 800-day trenching contract in July in the North Sea • Contracted 50 days well intervention work in the U.K. for 2026 • Executed three-year framework agreement with Exxon for well decommissioning work in the Gulf of America shelf Second Quarter 2025 Highlights 1 Adjusted EBITDA, Free Cash Flow and Net Debt are non-GAAP financial measures; see non-GAAP reconciliations below 2 Liquidity is calculated as the sum of cash and cash equivalents and availability under Helix’s ABL Facility, and excludes cash pledged to the ABL Facility 3 Long-term debt is presented net of unamortized discounts and deferred issuance costs 4 Revenue percentages net of intercompany eliminations Production Maximization 24% Decommissioning 59% Renewables 14% Other 3% Revenue By Market Strategy4 Quarter Ended June 30, 2025 |
| Operational Highlights |

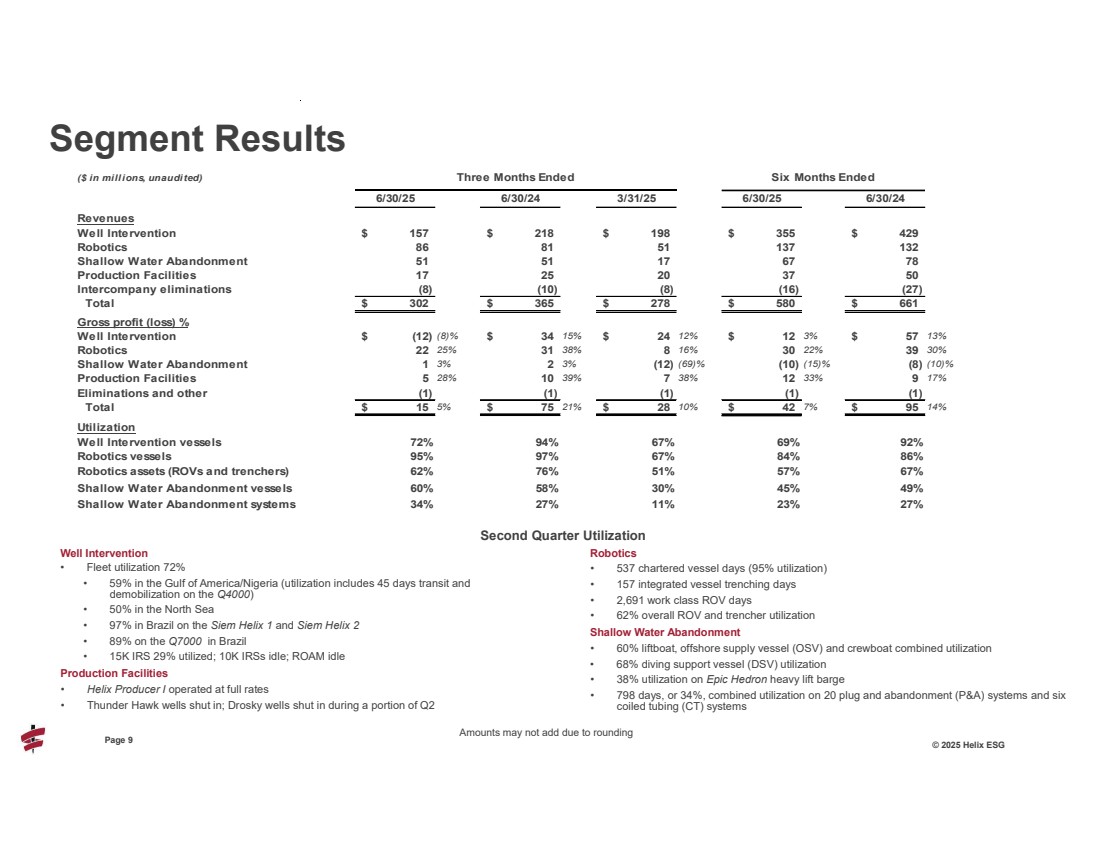
| 9 Page 9 © 2025 Helix ESG Well Intervention • Fleet utilization 72% • 59% in the Gulf of America/Nigeria (utilization includes 45 days transit and demobilization on the Q4000) • 50% in the North Sea • 97% in Brazil on the Siem Helix 1 and Siem Helix 2 • 89% on the Q7000 in Brazil • 15K IRS 29% utilized; 10K IRSs idle; ROAM idle Production Facilities • Helix Producer I operated at full rates • Thunder Hawk wells shut in; Drosky wells shut in during a portion of Q2 Robotics • 537 chartered vessel days (95% utilization) • 157 integrated vessel trenching days • 2,691 work class ROV days • 62% overall ROV and trencher utilization Shallow Water Abandonment • 60% liftboat, offshore supply vessel (OSV) and crewboat combined utilization • 68% diving support vessel (DSV) utilization • 38% utilization on Epic Hedron heavy lift barge • 798 days, or 34%, combined utilization on 20 plug and abandonment (P&A) systems and six coiled tubing (CT) systems Segment Results ($ in millions, unaudited) Three Months Ended Six Months Ended 6/30/25 6/30/24 3/31/25 6/30/25 6/30/24 Revenues Well Intervention 157 $ 218 $ 198 $ 355 $ 429 $ Robotics 86 81 51 137 132 Shallow Water Abandonment 51 51 17 67 78 Production Facilities 17 25 20 37 50 Intercompany eliminations (8) (10) (8) (16) (27) Total 302 $ 365 $ 278 $ 580 $ 661 $ Gross profit (loss) % Well Intervention (12) $ (8)% $ 34 15% $ 24 12% $ 12 3% $ 57 13% Robotics 22 25% 31 38% 8 16% 30 22% 39 30% Shallow Water Abandonment 1 3% 2 3% (12) (69)% (10) (15)% (8) (10)% Production Facilities 5 28% 10 39% 7 38% 12 33% 9 17% Eliminations and other (1) (1) (1) (1) (1) Total 15 $ 5% $ 75 21% $ 28 10% $ 42 7% $ 95 14% Utilization Well Intervention vessels 72% 94% 67% 69% 92% Robotics vessels 95% 97% 67% 84% 86% Robotics assets (ROVs and trenchers) 62% 76% 51% 57% 67% Shallow Water Abandonment vessels 60% 58% 30% 45% 49% Shallow Water Abandonment systems 34% 27% 11% 23% 27% Amounts may not add due to rounding Second Quarter Utilization |
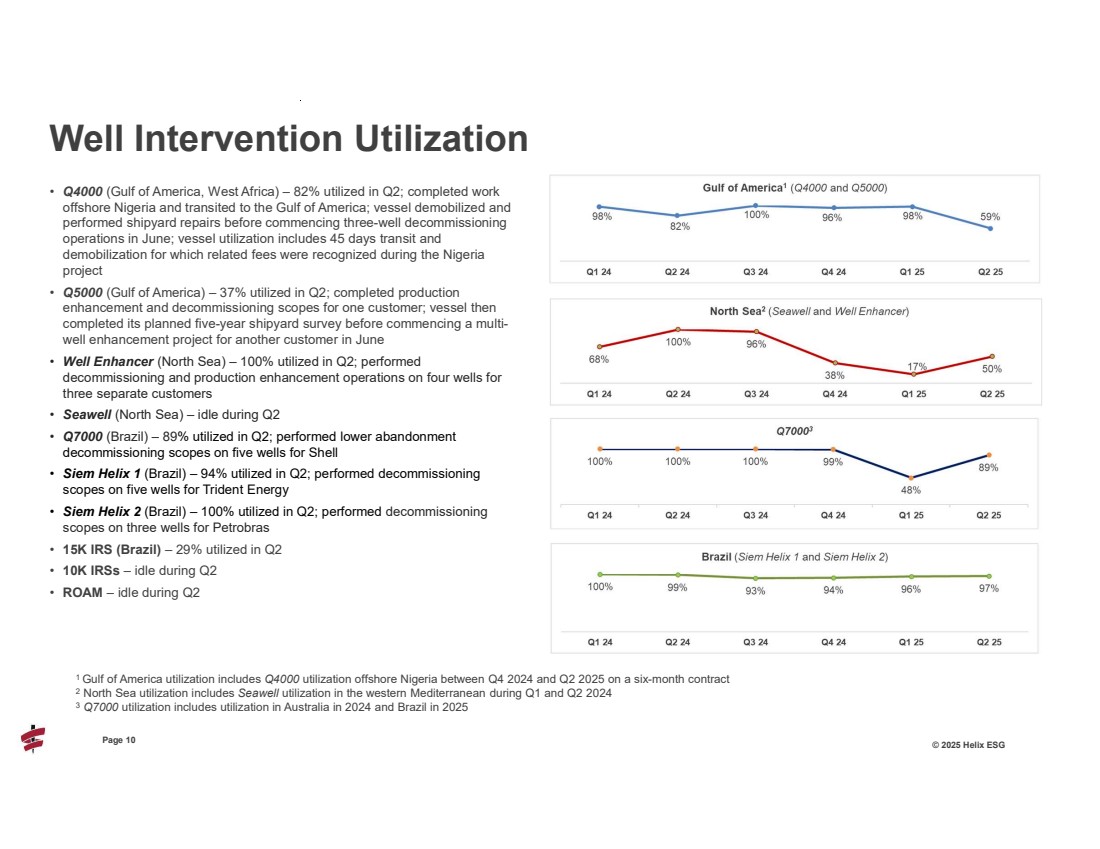
| 10 Page 10 © 2025 Helix ESG • Q4000 (Gulf of America, West Africa) – 82% utilized in Q2; completed work offshore Nigeria and transited to the Gulf of America; vessel demobilized and performed shipyard repairs before commencing three-well decommissioning operations in June; vessel utilization includes 45 days transit and demobilization for which related fees were recognized during the Nigeria project • Q5000 (Gulf of America) – 37% utilized in Q2; completed production enhancement and decommissioning scopes for one customer; vessel then completed its planned five-year shipyard survey before commencing a multi-well enhancement project for another customer in June • Well Enhancer (North Sea) – 100% utilized in Q2; performed decommissioning and production enhancement operations on four wells for three separate customers • Seawell (North Sea) – idle during Q2 • Q7000 (Brazil) – 89% utilized in Q2; performed lower abandonment decommissioning scopes on five wells for Shell • Siem Helix 1 (Brazil) – 94% utilized in Q2; performed decommissioning scopes on five wells for Trident Energy • Siem Helix 2 (Brazil) – 100% utilized in Q2; performed decommissioning scopes on three wells for Petrobras • 15K IRS (Brazil) – 29% utilized in Q2 • 10K IRSs – idle during Q2 • ROAM – idle during Q2 Well Intervention Utilization 1 Gulf of America utilization includes Q4000 utilization offshore Nigeria between Q4 2024 and Q2 2025 on a six-month contract 2 North Sea utilization includes Seawell utilization in the western Mediterranean during Q1 and Q2 2024 3 Q7000 utilization includes utilization in Australia in 2024 and Brazil in 2025 |
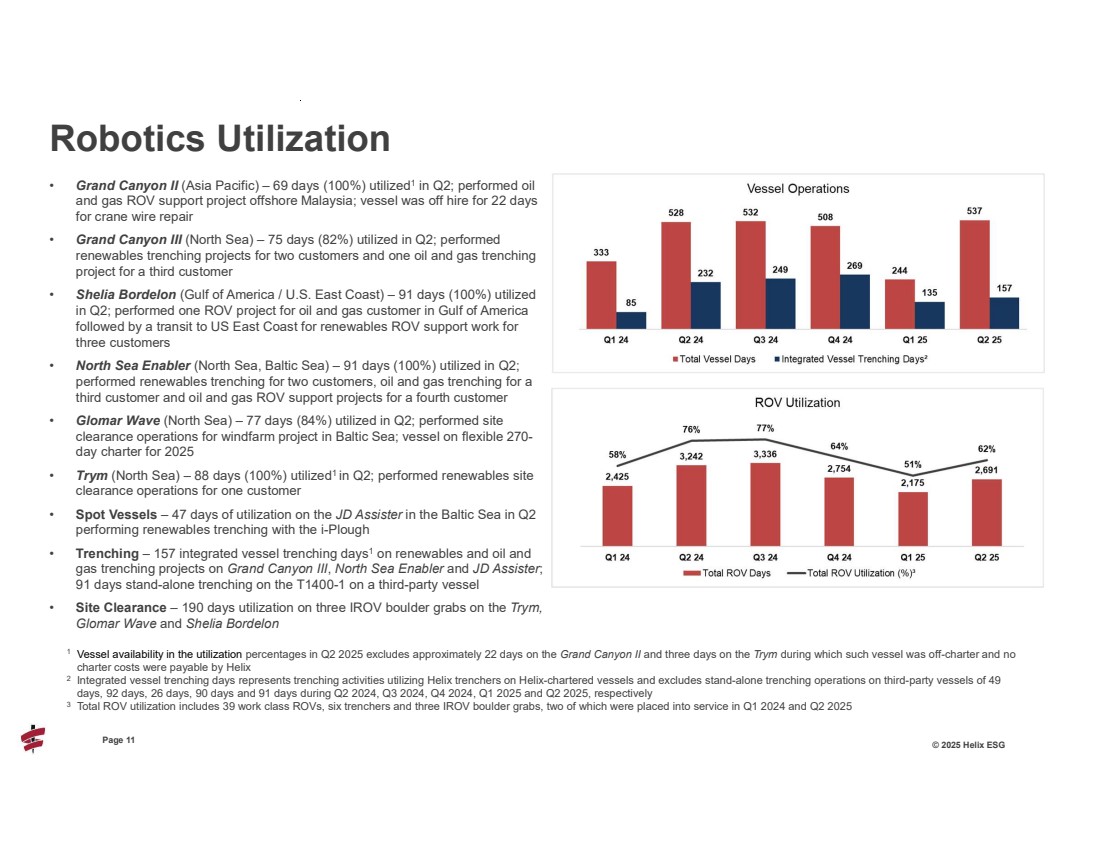
| 11 Page 11 © 2025 Helix ESG • Grand Canyon II (Asia Pacific) – 69 days (100%) utilized1 in Q2; performed oil and gas ROV support project offshore Malaysia; vessel was off hire for 22 days for crane wire repair • Grand Canyon III (North Sea) – 75 days (82%) utilized in Q2; performed renewables trenching projects for two customers and one oil and gas trenching project for a third customer • Shelia Bordelon (Gulf of America / U.S. East Coast) – 91 days (100%) utilized in Q2; performed one ROV project for oil and gas customer in Gulf of America followed by a transit to US East Coast for renewables ROV support work for three customers • North Sea Enabler (North Sea, Baltic Sea) – 91 days (100%) utilized in Q2; performed renewables trenching for two customers, oil and gas trenching for a third customer and oil and gas ROV support projects for a fourth customer • Glomar Wave (North Sea) – 77 days (84%) utilized in Q2; performed site clearance operations for windfarm project in Baltic Sea; vessel on flexible 270- day charter for 2025 • Trym (North Sea) – 88 days (100%) utilized1 in Q2; performed renewables site clearance operations for one customer • Spot Vessels – 47 days of utilization on the JD Assister in the Baltic Sea in Q2 performing renewables trenching with the i-Plough • Trenching – 157 integrated vessel trenching days1 on renewables and oil and gas trenching projects on Grand Canyon III, North Sea Enabler and JD Assister; 91 days stand-alone trenching on the T1400-1 on a third-party vessel • Site Clearance – 190 days utilization on three IROV boulder grabs on the Trym, Glomar Wave and Shelia Bordelon Robotics Utilization 1 Vessel availability in the utilization percentages in Q2 2025 excludes approximately 22 days on the Grand Canyon II and three days on the Trym during which such vessel was off-charter and no charter costs were payable by Helix 2 Integrated vessel trenching days represents trenching activities utilizing Helix trenchers on Helix-chartered vessels and excludes stand-alone trenching operations on third-party vessels of 49 days, 92 days, 26 days, 90 days and 91 days during Q2 2024, Q3 2024, Q4 2024, Q1 2025 and Q2 2025, respectively 3 Total ROV utilization includes 39 work class ROVs, six trenchers and three IROV boulder grabs, two of which were placed into service in Q1 2024 and Q2 2025 |
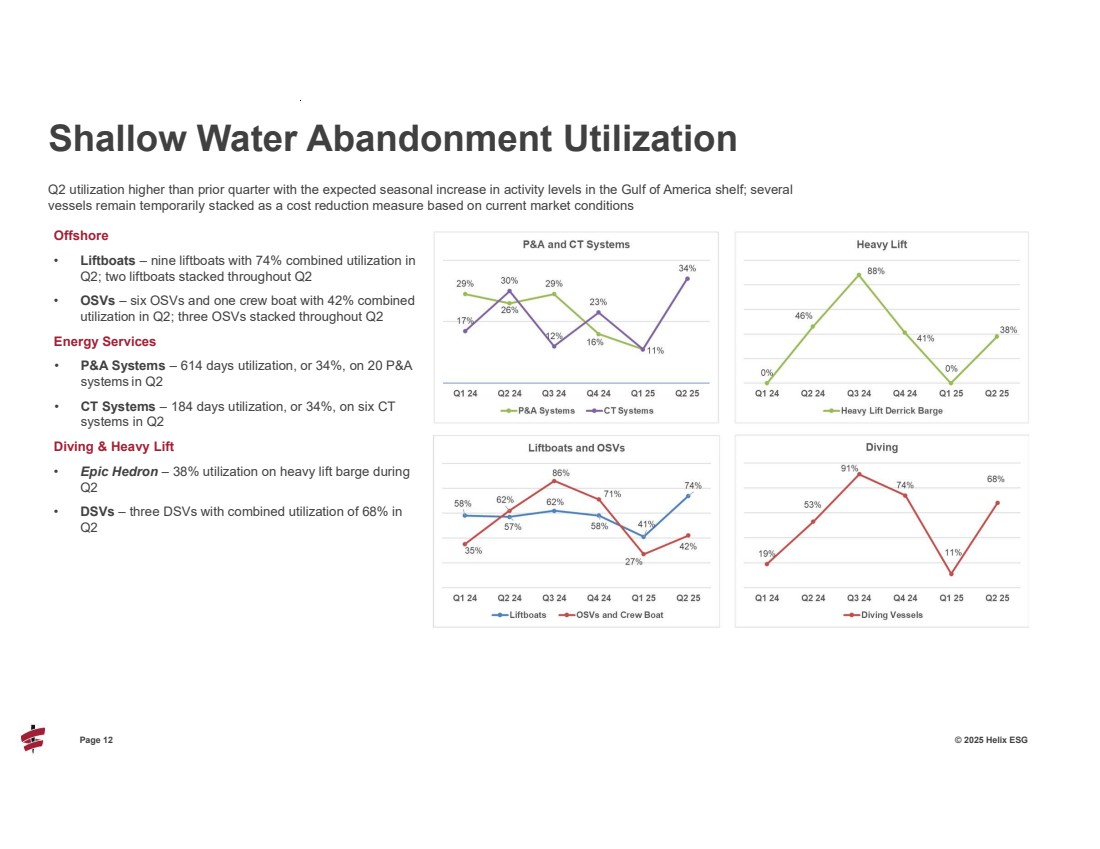
| Page 12 © 2025 Helix ESG Q2 utilization higher than prior quarter with the expected seasonal increase in activity levels in the Gulf of America shelf; several vessels remain temporarily stacked as a cost reduction measure based on current market conditions Shallow Water Abandonment Utilization Offshore • Liftboats – nine liftboats with 74% combined utilization in Q2; two liftboats stacked throughout Q2 • OSVs – six OSVs and one crew boat with 42% combined utilization in Q2; three OSVs stacked throughout Q2 Energy Services • P&A Systems – 614 days utilization, or 34%, on 20 P&A systems in Q2 • CT Systems – 184 days utilization, or 34%, on six CT systems in Q2 Diving & Heavy Lift • Epic Hedron – 38% utilization on heavy lift barge during Q2 • DSVs – three DSVs with combined utilization of 68% in Q2 |
| Key Financial Metrics |

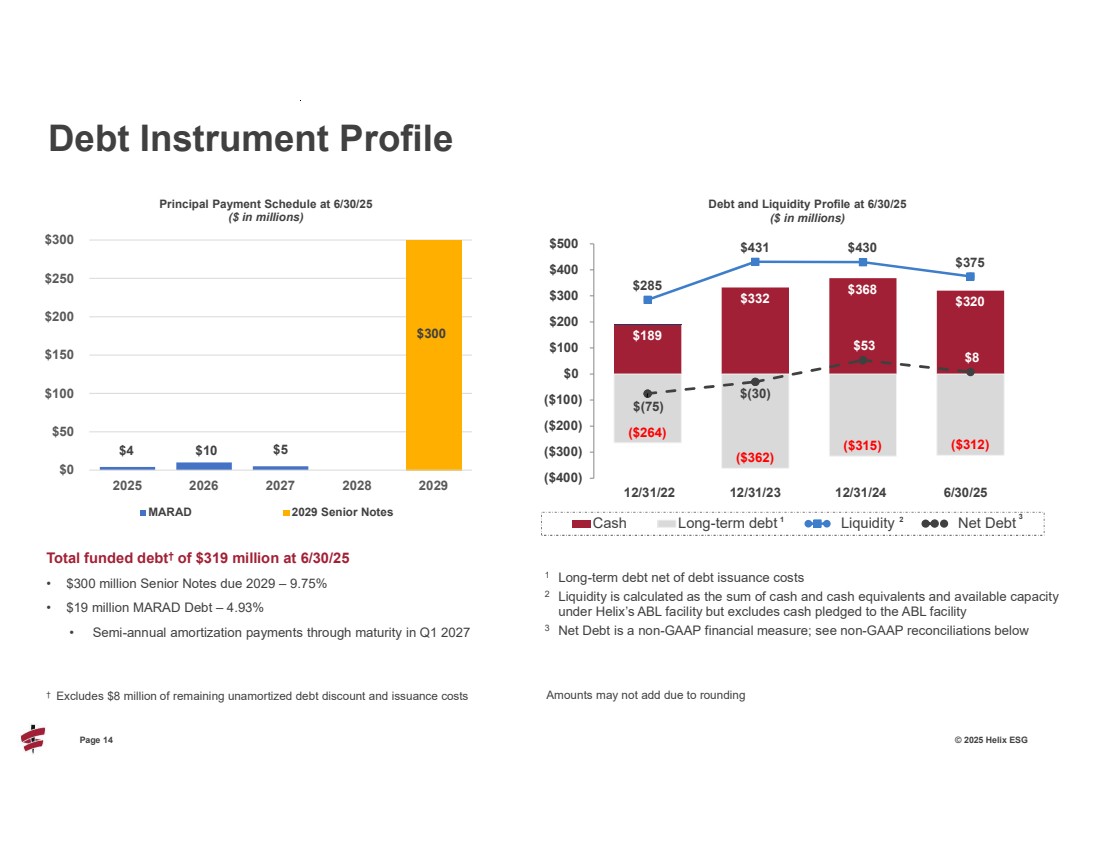
| Page 14 © 2025 Helix ESG Total funded debt† of $319 million at 6/30/25 • $300 million Senior Notes due 2029 – 9.75% • $19 million MARAD Debt – 4.93% • Semi-annual amortization payments through maturity in Q1 2027 Debt Instrument Profile † Excludes $8 million of remaining unamortized debt discount and issuance costs $4 $10 $5 $300 $0 $50 $100 $150 $200 $250 $300 2025 2026 2027 2028 2029 Principal Payment Schedule at 6/30/25 ($ in millions) MARAD 2029 Senior Notes $189 $332 $368 $320 ($264) ($362) ($315) ($312) $285 $431 $430 $375 $(75) $(30) $53 $8 ($400) ($300) ($200) ($100) $0 $100 $200 $300 $400 $500 Cash Long-term debt Liquidity Net Debt 12/31/22 12/31/23 12/31/24 6/30/25 Debt and Liquidity Profile at 6/30/25 ($ in millions) 1 Long-term debt net of debt issuance costs 2 Liquidity is calculated as the sum of cash and cash equivalents and available capacity under Helix’s ABL facility but excludes cash pledged to the ABL facility 3 Net Debt is a non-GAAP financial measure; see non-GAAP reconciliations below 1 2 3 Amounts may not add due to rounding |
| 2025 Outlook |
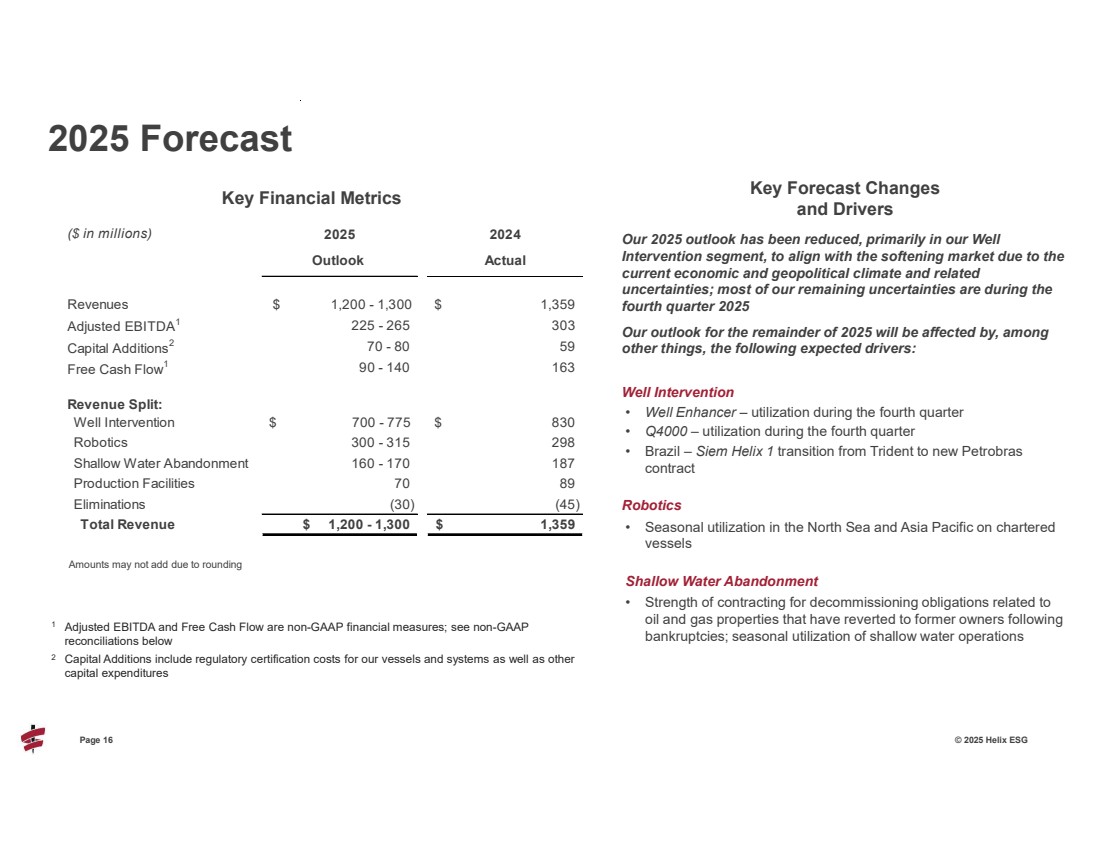
| Page 16 © 2025 Helix ESG Our 2025 outlook has been reduced, primarily in our Well Intervention segment, to align with the softening market due to the current economic and geopolitical climate and related uncertainties; most of our remaining uncertainties are during the fourth quarter 2025 Our outlook for the remainder of 2025 will be affected by, among other things, the following expected drivers: Well Intervention • Well Enhancer – utilization during the fourth quarter • Q4000 – utilization during the fourth quarter • Brazil – Siem Helix 1 transition from Trident to new Petrobras contract Robotics • Seasonal utilization in the North Sea and Asia Pacific on chartered vessels Shallow Water Abandonment • Strength of contracting for decommissioning obligations related to oil and gas properties that have reverted to former owners following bankruptcies; seasonal utilization of shallow water operations 2025 Forecast ($ in millions) 2025 2024 Outlook Actual Revenues $ 1,200 - 1,300 1,359 $ Adjusted EBITDA1 225 - 265 303 Capital Additions2 70 - 80 59 Free Cash Flow1 90 - 140 163 Revenue Split: Well Intervention $ 700 - 775 830 $ Robotics 300 - 315 298 Shallow Water Abandonment 160 - 170 187 Production Facilities 70 89 Eliminations (30) (45) Total Revenue $ 1,200 - 1,300 1,359 $ 1 Adjusted EBITDA and Free Cash Flow are non-GAAP financial measures; see non-GAAP reconciliations below 2 Capital Additions include regulatory certification costs for our vessels and systems as well as other capital expenditures Key Financial Metrics Key Forecast Changes and Drivers Amounts may not add due to rounding |
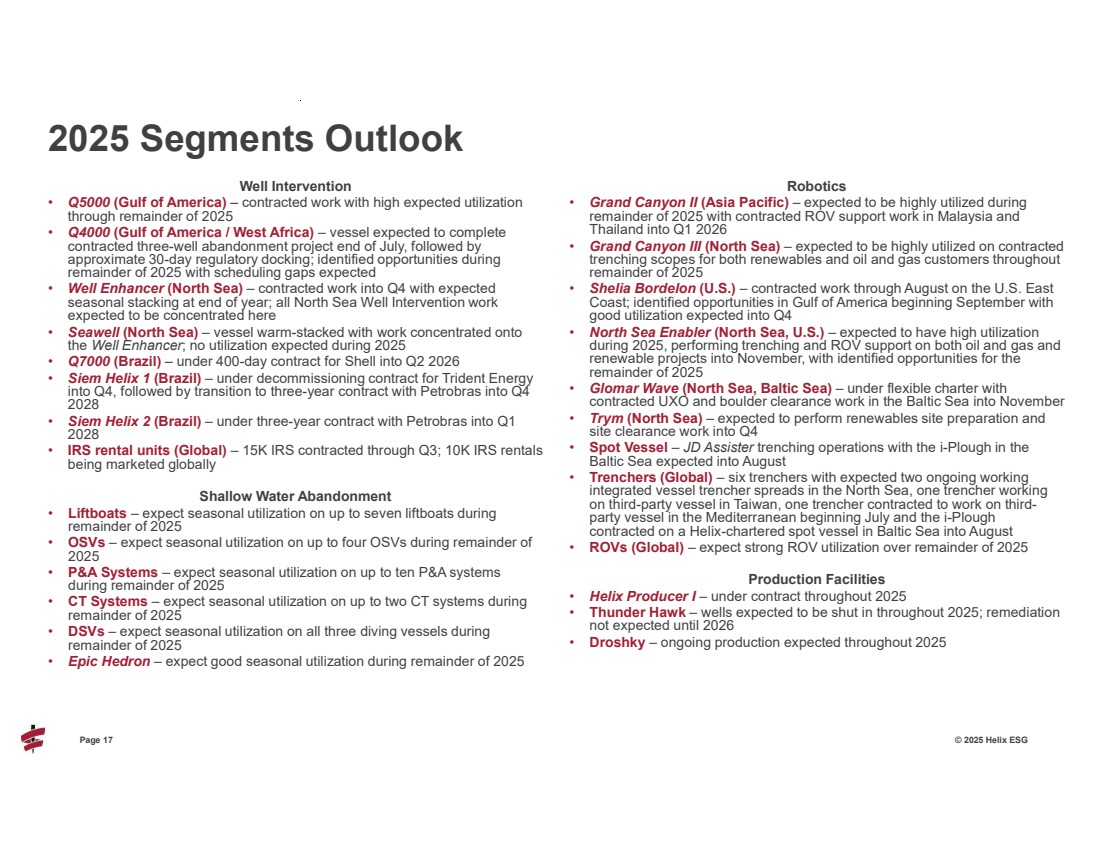
| Page 17 © 2025 Helix ESG Well Intervention • Q5000 (Gulf of America) – contracted work with high expected utilization through remainder of 2025 • Q4000 (Gulf of America / West Africa) – vessel expected to complete contracted three-well abandonment project end of July, followed by approximate 30-day regulatory docking; identified opportunities during remainder of 2025 with scheduling gaps expected • Well Enhancer (North Sea) – contracted work into Q4 with expected seasonal stacking at end of year; all North Sea Well Intervention work expected to be concentrated here • Seawell (North Sea) – vessel warm-stacked with work concentrated onto the Well Enhancer; no utilization expected during 2025 • Q7000 (Brazil) – under 400-day contract for Shell into Q2 2026 • Siem Helix 1 (Brazil) – under decommissioning contract for Trident Energy into Q4, followed by transition to three-year contract with Petrobras into Q4 2028 • Siem Helix 2 (Brazil) – under three-year contract with Petrobras into Q1 2028 • IRS rental units (Global) – 15K IRS contracted through Q3; 10K IRS rentals being marketed globally Shallow Water Abandonment • Liftboats – expect seasonal utilization on up to seven liftboats during remainder of 2025 • OSVs – expect seasonal utilization on up to four OSVs during remainder of 2025 • P&A Systems – expect seasonal utilization on up to ten P&A systems during remainder of 2025 • CT Systems – expect seasonal utilization on up to two CT systems during remainder of 2025 • DSVs – expect seasonal utilization on all three diving vessels during remainder of 2025 • Epic Hedron – expect good seasonal utilization during remainder of 2025 Robotics • Grand Canyon II (Asia Pacific) – expected to be highly utilized during remainder of 2025 with contracted ROV support work in Malaysia and Thailand into Q1 2026 • Grand Canyon III (North Sea) – expected to be highly utilized on contracted trenching scopes for both renewables and oil and gas customers throughout remainder of 2025 • Shelia Bordelon (U.S.) – contracted work through August on the U.S. East Coast; identified opportunities in Gulf of America beginning September with good utilization expected into Q4 • North Sea Enabler (North Sea, U.S.) – expected to have high utilization during 2025, performing trenching and ROV support on both oil and gas and renewable projects into November, with identified opportunities for the remainder of 2025 • Glomar Wave (North Sea, Baltic Sea) – under flexible charter with contracted UXO and boulder clearance work in the Baltic Sea into November • Trym (North Sea) – expected to perform renewables site preparation and site clearance work into Q4 • Spot Vessel – JD Assister trenching operations with the i-Plough in the Baltic Sea expected into August • Trenchers (Global) – six trenchers with expected two ongoing working integrated vessel trencher spreads in the North Sea, one trencher working on third-party vessel in Taiwan, one trencher contracted to work on third-party vessel in the Mediterranean beginning July and the i-Plough contracted on a Helix-chartered spot vessel in Baltic Sea into August • ROVs (Global) – expect strong ROV utilization over remainder of 2025 Production Facilities • Helix Producer I – under contract throughout 2025 • Thunder Hawk – wells expected to be shut in throughout 2025; remediation not expected until 2026 • Droshky – ongoing production expected throughout 2025 2025 Segments Outlook |
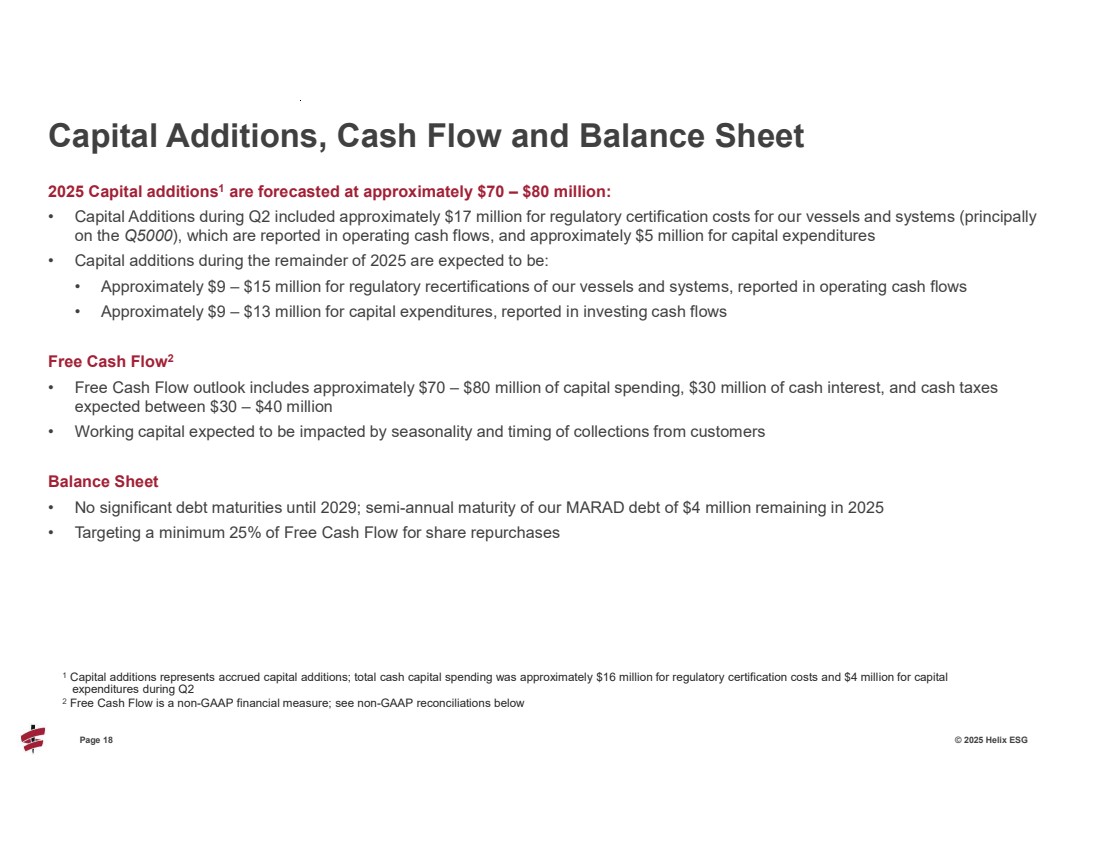
| Page 18 © 2025 Helix ESG 2025 Capital additions1 are forecasted at approximately $70 – $80 million: • Capital Additions during Q2 included approximately $17 million for regulatory certification costs for our vessels and systems (principally on the Q5000), which are reported in operating cash flows, and approximately $5 million for capital expenditures • Capital additions during the remainder of 2025 are expected to be: • Approximately $9 – $15 million for regulatory recertifications of our vessels and systems, reported in operating cash flows • Approximately $9 – $13 million for capital expenditures, reported in investing cash flows Free Cash Flow2 • Free Cash Flow outlook includes approximately $70 – $80 million of capital spending, $30 million of cash interest, and cash taxes expected between $30 – $40 million • Working capital expected to be impacted by seasonality and timing of collections from customers Balance Sheet • No significant debt maturities until 2029; semi-annual maturity of our MARAD debt of $4 million remaining in 2025 • Targeting a minimum 25% of Free Cash Flow for share repurchases Capital Additions, Cash Flow and Balance Sheet 1 Capital additions represents accrued capital additions; total cash capital spending was approximately $16 million for regulatory certification costs and $4 million for capital expenditures during Q2 2 Free Cash Flow is a non-GAAP financial measure; see non-GAAP reconciliations below |
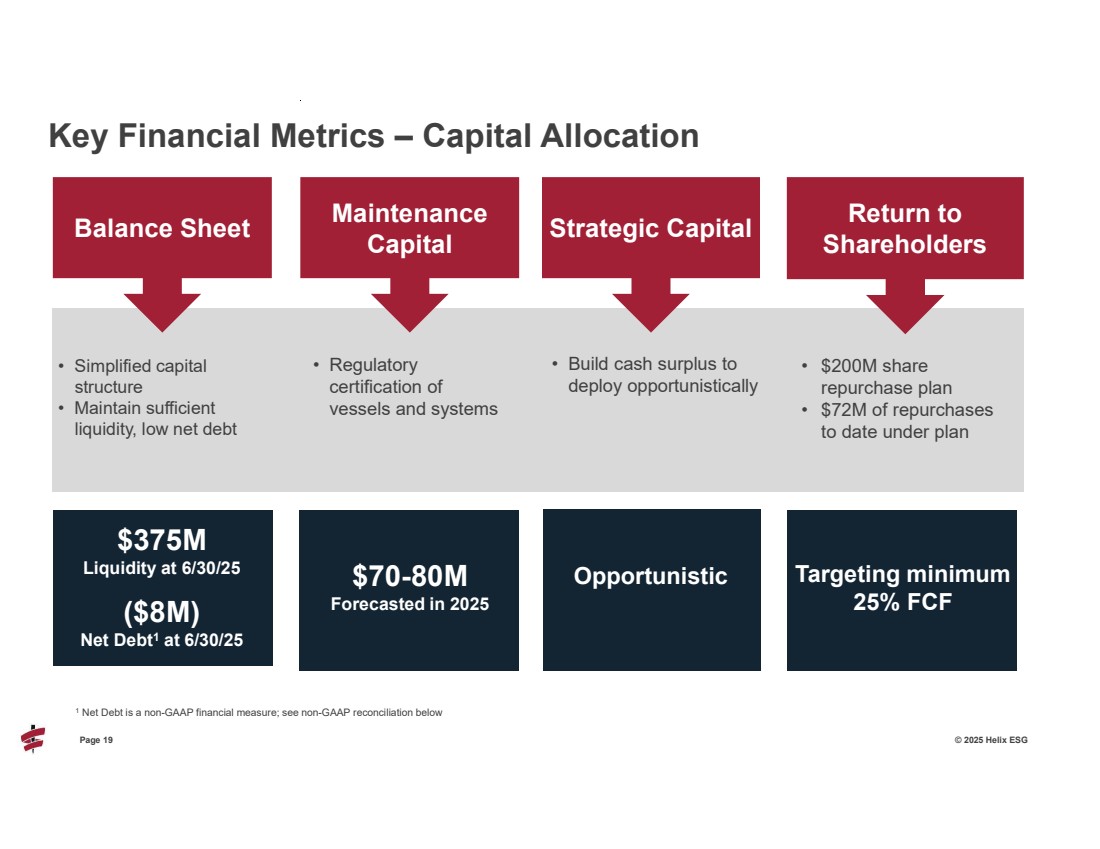
| Page 19 © 2025 Helix ESG Key Financial Metrics – Capital Allocation Strategic Capital • Build cash surplus to deploy opportunistically Return to Shareholders • $200M share repurchase plan • $72M of repurchases to date under plan Maintenance Capital • Regulatory certification of vessels and systems Balance Sheet • Simplified capital structure • Maintain sufficient liquidity, low net debt $375M Liquidity at 6/30/25 ($8M) Net Debt1 at 6/30/25 Targeting minimum 25% FCF $70-80M Forecasted in 2025 Opportunistic 1 Net Debt is a non-GAAP financial measure; see non-GAAP reconciliation below |
| Non-GAAP Reconciliations and Supplemental Information |
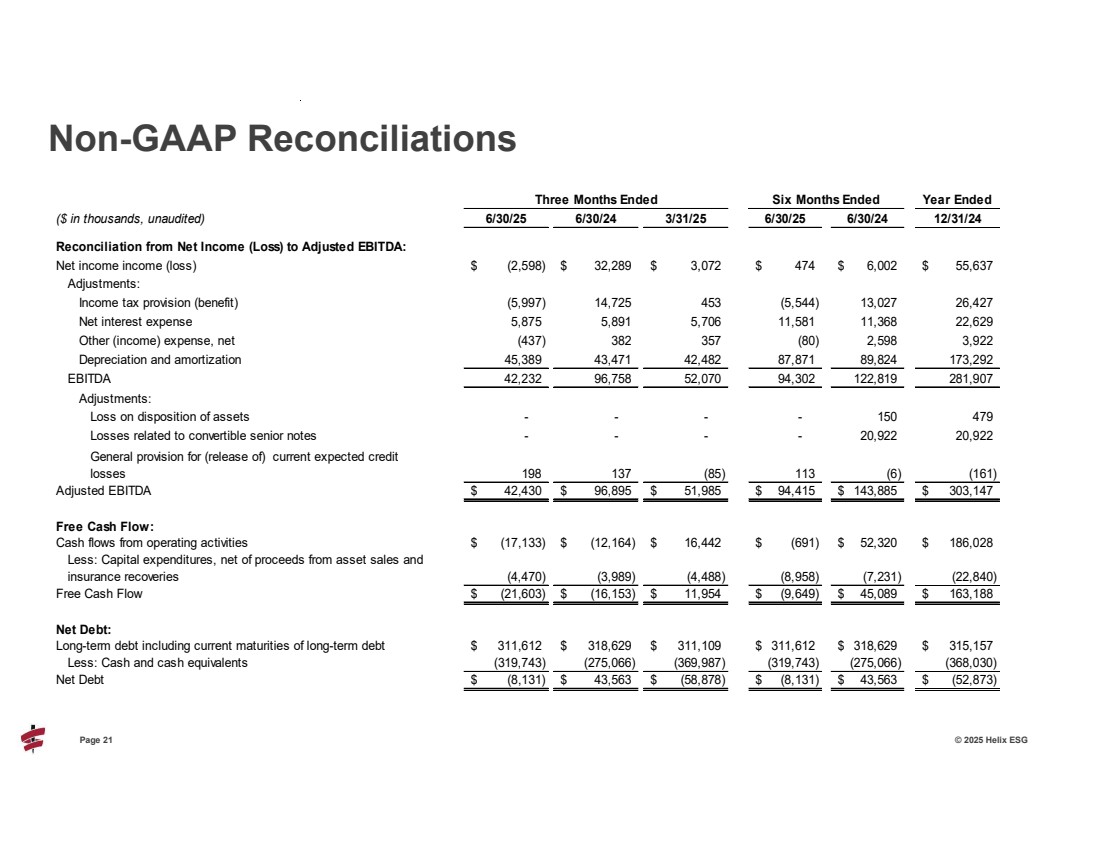
| Page 21 © 2025 Helix ESG Non-GAAP Reconciliations Year Ended ($ in thousands, unaudited) 6/30/25 6/30/24 3/31/25 6/30/25 6/30/24 12/31/24 Reconciliation from Net Income (Loss) to Adjusted EBITDA: Net income income (loss) (2,598) $ 32,289 $ 3,072 $ 474 $ 6,002 $ 55,637 $ Adjustments: Income tax provision (benefit) (5,997) 14,725 453 (5,544) 13,027 26,427 Net interest expense 5,875 5,891 5,706 11,581 11,368 22,629 Other (income) expense, net (437) 382 357 (80) 2,598 3,922 Depreciation and amortization 45,389 43,471 42,482 87,871 89,824 173,292 EBITDA 42,232 96,758 52,070 94,302 122,819 281,907 Adjustments: Loss on disposition of assets - - - - 150 479 Losses related to convertible senior notes - - - - 20,922 20,922 General provision for (release of) current expected credit losses 198 137 (85) 113 (6) (161) Adjusted EBITDA 42,430 $ 96,895 $ 51,985 $ 94,415 $ 143,885 $ 303,147 $ Free Cash Flow: Cash flows from operating activities (17,133) $ (12,164) $ 16,442 $ (691) $ 52,320 $ 186,028 $ Less: Capital expenditures, net of proceeds from asset sales and insurance recoveries (4,470) (3,989) (4,488) (8,958) (7,231) (22,840) Free Cash Flow (21,603) $ (16,153) $ 11,954 $ (9,649) $ 45,089 $ 163,188 $ Net Debt: Long-term debt including current maturities of long-term debt 311,612 $ 318,629 $ 311,109 $ 311,612 $ 318,629 $ 315,157 $ Less: Cash and cash equivalents (319,743) (275,066) (369,987) (319,743) (275,066) (368,030) Net Debt (8,131) $ 43,563 $ (58,878) $ (8,131) $ 43,563 $ (52,873) $ Three Months Ended Six Months Ended |
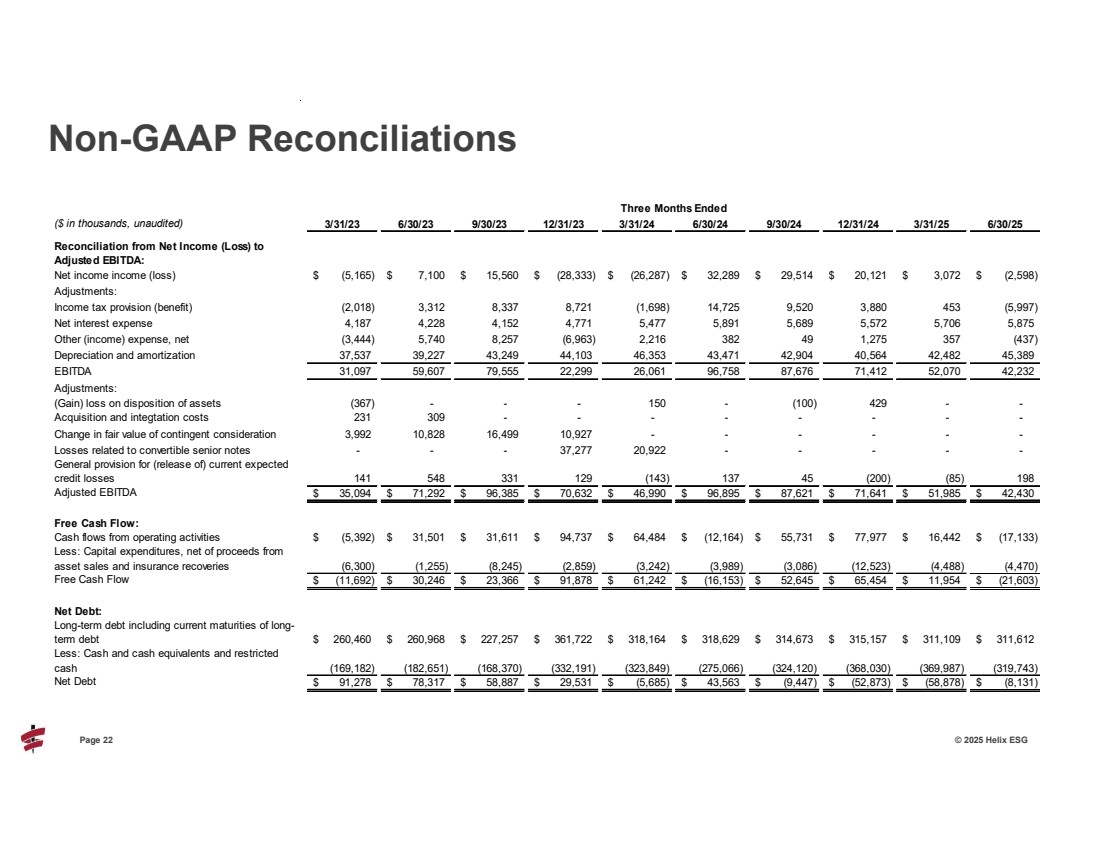
| Page 22 © 2025 Helix ESG Non-GAAP Reconciliations ($ in thousands, unaudited) 3/31/23 6/30/23 9/30/23 12/31/23 3/31/24 6/30/24 9/30/24 12/31/24 3/31/25 6/30/25 Reconciliation from Net Income (Loss) to Adjusted EBITDA: Net income income (loss) (5,165) $ 7,100 $ 15,560 $ (28,333) $ (26,287) $ 32,289 $ 29,514 $ 20,121 $ 3,072 $ (2,598) $ Adjustments: Income tax provision (benefit) (2,018) 3,312 8,337 8,721 (1,698) 14,725 9,520 3,880 453 (5,997) Net interest expense 4,187 4,228 4,152 4,771 5,477 5,891 5,689 5,572 5,706 5,875 Other (income) expense, net (3,444) 5,740 8,257 (6,963) 2,216 382 49 1,275 357 (437) Depreciation and amortization 37,537 39,227 43,249 44,103 46,353 43,471 42,904 40,564 42,482 45,389 EBITDA 31,097 59,607 79,555 22,299 26,061 96,758 87,676 71,412 52,070 42,232 Adjustments: (Gain) loss on disposition of assets (367) - - - 150 - (100) 429 - - Acquisition and integtation costs 231 309 - - - - - - - - Change in fair value of contingent consideration 3,992 10,828 16,499 10,927 - - - - - - Losses related to convertible senior notes - - - 37,277 20,922 - - - - - General provision for (release of) current expected credit losses 141 548 331 129 (143) 137 45 (200) (85) 198 Adjusted EBITDA $ 71,292 35,094 $ 96,385 $ 70,632 $ 46,990 $ 96,895 $ 87,621 $ 71,641 $ 51,985 $ 42,430 $ Free Cash Flow: Cash flows from operating activities (5,392) $ 31,501 $ 31,611 $ 94,737 $ 64,484 $ (12,164) $ 55,731 $ 77,977 $ 16,442 $ (17,133) $ Less: Capital expenditures, net of proceeds from asset sales and insurance recoveries (6,300) (1,255) (8,245) (2,859) (3,242) (3,989) (3,086) (12,523) (4,488) (4,470) Free Cash Flow $ 30,246 (11,692) $ 23,366 $ 91,878 $ 61,242 $ (16,153) $ 52,645 $ 65,454 $ 11,954 $ (21,603) $ Net Debt: Long-term debt including current maturities of long-term debt 260,460 $ 260,968 $ 227,257 $ 361,722 $ 318,164 $ 318,629 $ 314,673 $ 315,157 $ 311,109 $ 311,612 $ Less: Cash and cash equivalents and restricted cash (169,182) (182,651) (168,370) (332,191) (323,849) (275,066) (324,120) (368,030) (369,987) (319,743) Net Debt $ 78,317 91,278 $ 58,887 $ 29,531 $ (5,685) $ 43,563 $ (9,447) $ (52,873) $ (58,878) $ (8,131) $ Three Months Ended |
| Page 23 © 2025 Helix ESG Non-GAAP Financial Measures We define EBITDA as earnings before income taxes, net interest expense, net other income or expense, and depreciation and amortization expense. Non-cash impairment losses on goodwill and other long-lived assets are also added back if applicable. To arrive at our measure of Adjusted EBITDA, we exclude gains or losses on disposition of assets, acquisition and integration costs, gains or losses related to convertible senior notes, the change in fair value of contingent consideration and the general provision (release) for current expected credit losses, if any. We define Free Cash Flow as cash flows from operating activities less capital expenditures, net of proceeds from asset sales and insurance recoveries (related to property and equipment), if any. Net debt is calculated as long-term debt including current maturities of long-term debt less cash and cash equivalents and restricted cash. We use EBITDA, Adjusted EBITDA, Free Cash Flow and Net Debt to monitor and facilitate internal evaluation of the performance of our business operations, to facilitate external comparison of our business results to those of others in our industry, to analyze and evaluate financial and strategic planning decisions regarding future investments and acquisitions, to plan and evaluate operating budgets, and in certain cases, to report our results to the holders of our debt as required by our debt covenants. We believe that our measures of EBITDA, Adjusted EBITDA, Free Cash Flow and Net Debt provide useful information to the public regarding our operating performance and ability to service debt and fund capital expenditures and may help our investors understand and compare our results to other companies that have different financing, capital and tax structures. Other companies may calculate their measures of EBITDA, Adjusted EBITDA, Free Cash Flow and Net Debt differently from the way we do, which may limit their usefulness as comparative measures. EBITDA, Adjusted EBITDA, Free Cash Flow and Net Debt should not be considered in isolation or as a substitute for, but instead are supplemental to, income from operations, net income, cash flows from operating activities, or other income or cash flow data prepared in accordance with GAAP. Users of this financial information should consider the types of events and transactions that are excluded from these measures. See reconciliation of the non-GAAP financial information presented in this press release to the most directly comparable financial information presented in accordance with GAAP. We have not provided reconciliations of forward-looking non-GAAP financial measures to comparable GAAP measures due to the challenges and impracticability with estimating some of the items without unreasonable effort, which amounts could be significant. Non-GAAP Reconciliations |
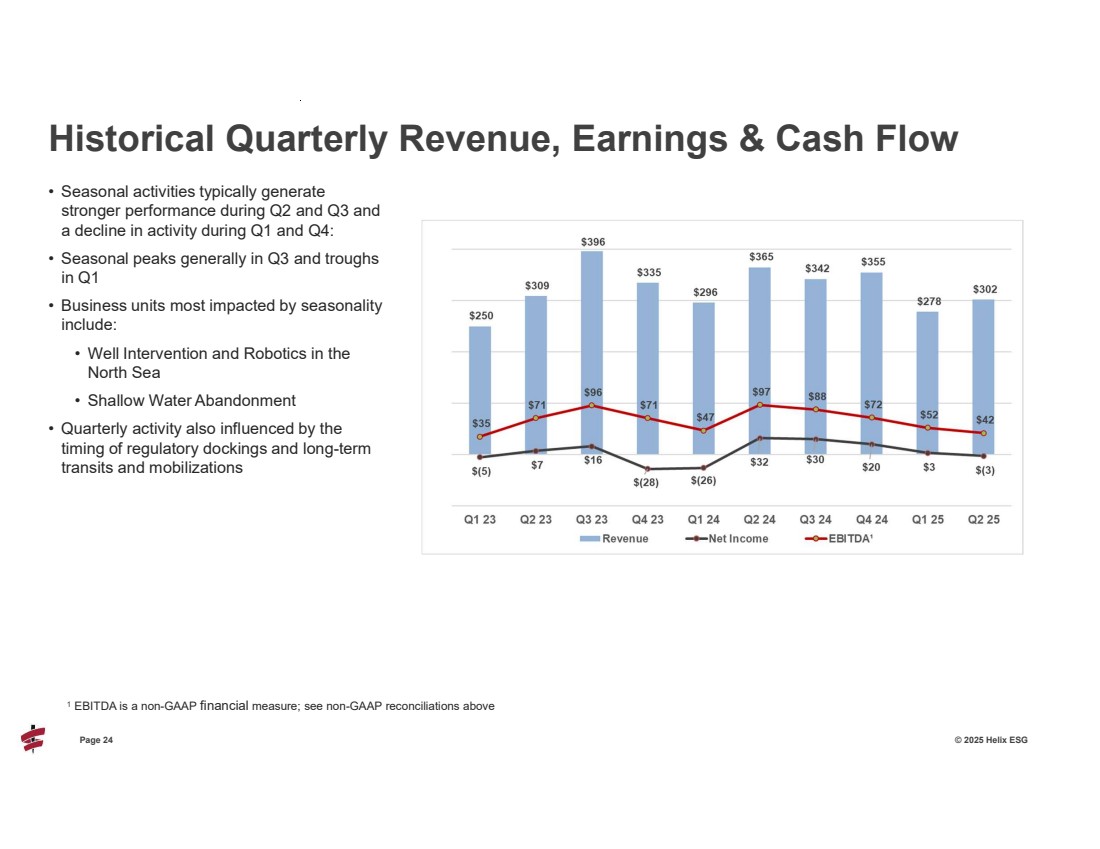
| Page 24 © 2025 Helix ESG • Seasonal activities typically generate stronger performance during Q2 and Q3 and a decline in activity during Q1 and Q4: • Seasonal peaks generally in Q3 and troughs in Q1 • Business units most impacted by seasonality include: • Well Intervention and Robotics in the North Sea • Shallow Water Abandonment • Quarterly activity also influenced by the timing of regulatory dockings and long-term transits and mobilizations Historical Quarterly Revenue, Earnings & Cash Flow 1 EBITDA is a non-GAAP financial measure; see non-GAAP reconciliations above |
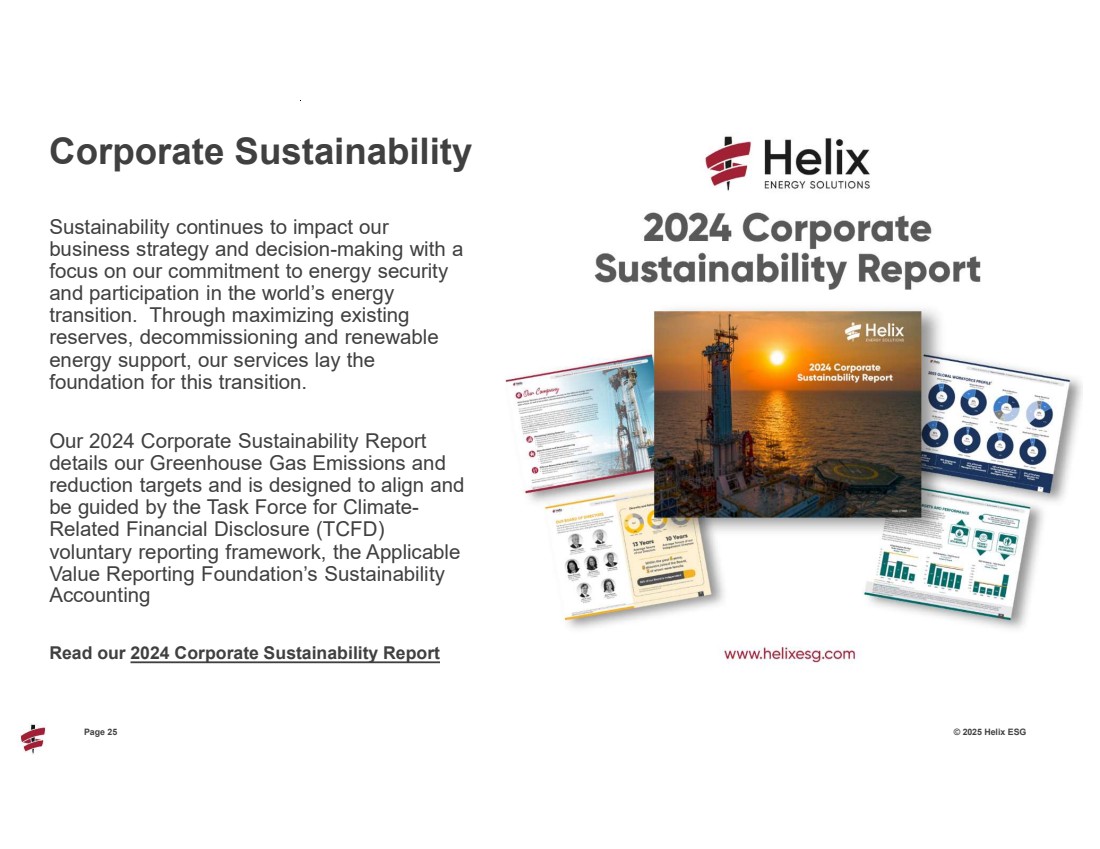
| 25 Page 25 © 2025 Helix ESG Sustainability continues to impact our business strategy and decision-making with a focus on our commitment to energy security and participation in the world’s energy transition. Through maximizing existing reserves, decommissioning and renewable energy support, our services lay the foundation for this transition. Our 2024 Corporate Sustainability Report details our Greenhouse Gas Emissions and reduction targets and is designed to align and be guided by the Task Force for Climate-Related Financial Disclosure (TCFD) voluntary reporting framework, the Applicable Value Reporting Foundation’s Sustainability Accounting Standards Board (SASB) – Oil Read our 2024 Corporate Sustainability Report Corporate Sustainability |
| 26 Page 26 © 2025 Helix ESG |